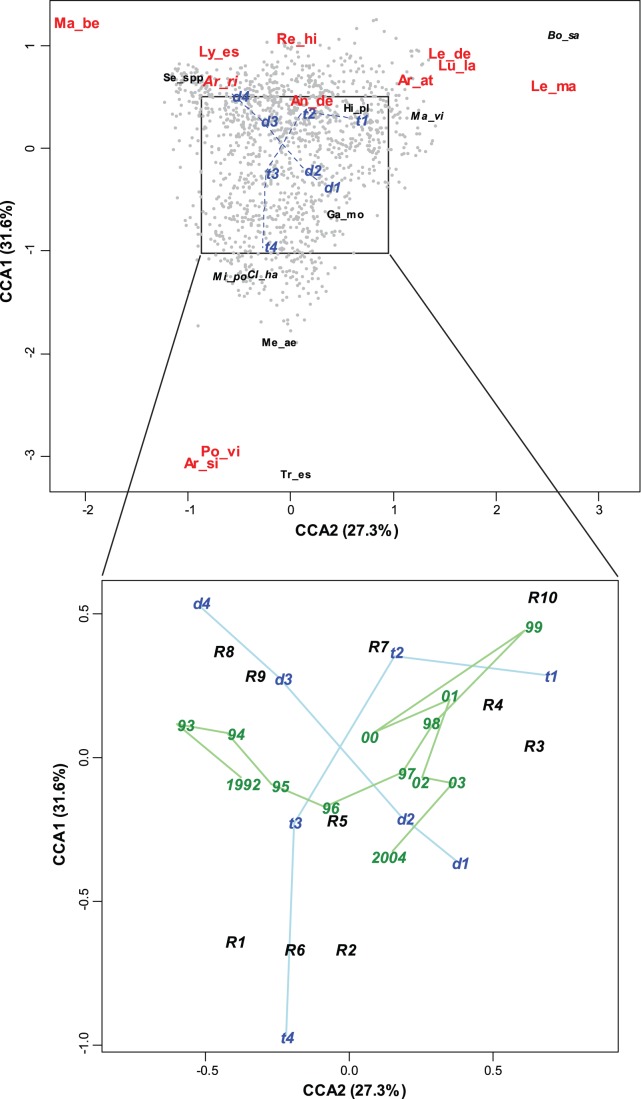
Figure 3. Canonical correspondence analysis (CCA) ordination biplot of axes 2 (horizontal) and axes 1 (vertical) of 55 fish taxa and 1360 stations in the period 1992−2004.
(a) The high-contributing species are labeled in black (small font), indicator species of the three distinct fish assemblages are labeled in red (large font), cold water NE assemblage (Ar_at = Artediellus atlanticus, Le_de = Leptagonus decagonus, Le_ma = Leptoclinus maculates and Lu_la = Lumpenus lampraetaeformis), warm water S assemblage (Ar_si = Argentina silus, Po_vi = Pollachius virens and Tr_es = Trisopterus esmarkii) and deep assemblage (Ly_es = Lycodes esmarkii, An_de = Anarhichas denticulatus and Re_hi = Reinhardtius hippoglossoides) previously defined by Fossheim et al. [30]. Pelagic species (in italics) are associated with the northern (Bo_sa = Boreogadus saida and Ma_vi = Mallotus villosus), southern (Mi_po = Micromesistius poutassou and Cl_ha = Clupea harengus) and deep assemblages (Ar_ri = Arctozenus risso). (b) Central section of Fig. 3a, showing the categories of bottom temperature (t) and depth (d), as in Fig. 3a, as well as those for the 10 regions (R) and the 13 years.

