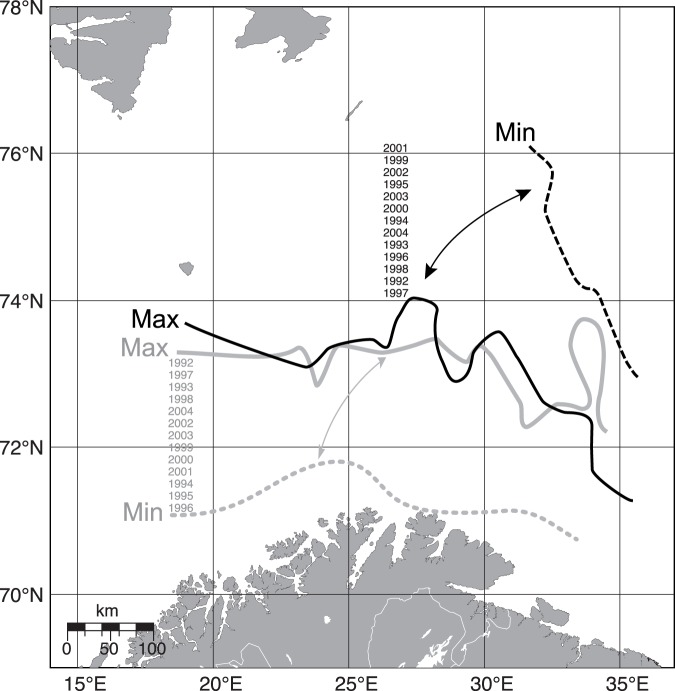
Figure 4. Distribution of assemblages.
Maximum and minimum distribution of the cold water NE assemblage (Artediellus atlanticus, Leptagonus decagonus, Leptoclinus maculates and Lumpenus lampraetaeformis) in black and the warm water S assemblage (Argentina silus, Pollachius virens and Trisopterus esmarkii) in grey. Max indicates the widest distribution of respective assemblage (area where ≥10 individuals of the key species group have been observed over time), and Min indicates the narrowest annual distribution of both key species groups in 1992 to 2004. The ranks of years indicate the position of the maximum and the minimum distribution of the S and NE assemblages each year.

