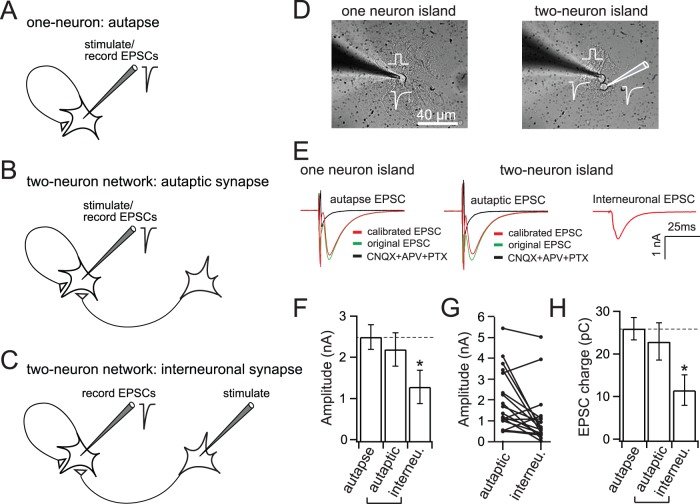
Figure 1. Autaptic synapses have larger EPSCs than interneuronal synapses.
(A) Cartoon of an autapse, in which a single neuron growing on a micro-glial island innervates itself, and thus can be stimulated and recorded from at the same time. (B) Recording scheme for autaptic synapses, and interneuronal synapses (C) in two-neuron micronetworks. (D) Image of micro-island cultures consisting of one (left panel) or two (right panel) hippocampal neurons. (E) Representative single EPSC recordings from an autapse (left) and from autaptic or interneuronal synapses in two-neuron micronetworks. The autaptic response (calibrated EPSC) was calculated by subtracting the offset current, due to the action potential preceding the EPSC, from the original EPSC; the offset current was determined by adding CNQX to block AMPA receptors. (F) EPSC amplitude in single neuron autapses (2.5±0.3 nA), and in autaptic (2.2±0.4 nA), and interneuronal (1.3±0.4 nA) synapses in two-neuron micronetworks. Autaptic synapse EPSC amplitude in both one and two-neuron micro-islands is larger than interneuronal EPSC amplitude. (G) Pairwise plot showing autaptic and interneuronal amplitudes recorded from neurons in two-neuron networks: 75% of pairs exhibited higher EPSCs in autaptic synapses than in interneuronal synapses, where interneuronal synapses had 66.9±13.1% of the EPSC amplitude of autaptic synapses. (H) EPSC charge in autapses (26.0±2.6 pC) and autaptic synapses in two-neuron networks (23.0±4.4 pC), is significantly larger than in interneuronal synapses (11.7±3.6 pC). Statistical significance was determined by one-way ANOVA and Newman-Keuls post-hoc test. * = p<0.05, n = 18 (autapses), 20 (autaptic synapses in two-neuron micronetworks), 20 (interneuronal synapses in two-neuron networks). All data shown represent mean ± SEM.

