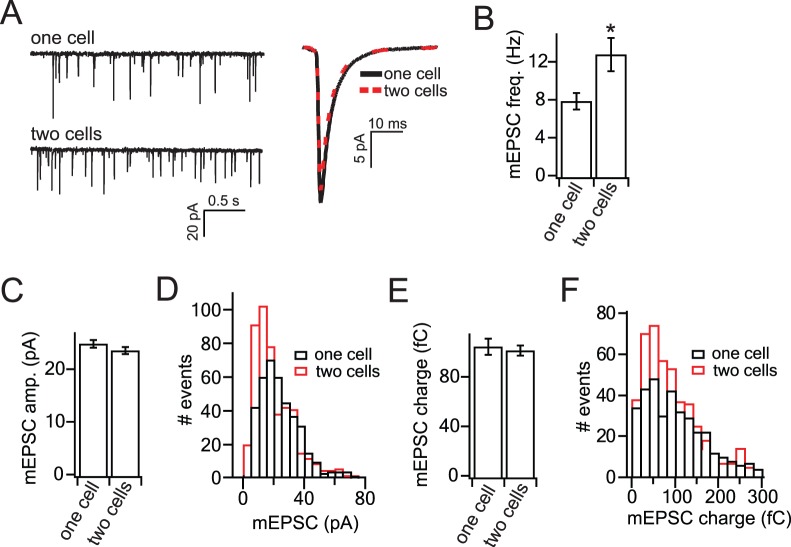
Figure 3. Autapses have reduced mEPSC frequency but no change in mEPSC amplitude, compared to neurons in two-cell micronetworks.
(A) Representative mEPSC recordings from neurons in one-cell or two-cell micronetworks. (B) Average mEPSC frequency recorded from one-cell island autapses and from neurons in two-cell micronetworks. (C) Average mEPSC amplitude in one-cell autapses and from neurons in two-cell micronetworks. (D) Distribution of mEPSC amplitudes in one and two-cell networks (bin = 5 pA). (E) Average mEPSC charge recorded from one-cell and two-cell micronetworks. (F) Distribution of mEPSC charge in one and two-cell networks (bin = 20 fC). For B, C, and E, n = 18 autapses and 20 neurons from two-neuron micronetworks. For distributions in D and F, n = 400 mEPSCs from one-cell islands and 470 mEPSCs from two-cell islands. Statistical significance was determined by Student’s t-test (B, C, E) or Kolmogorov-Smirnov test (D, F). * = p<0.05. All data shown represent mean ± SEM.

