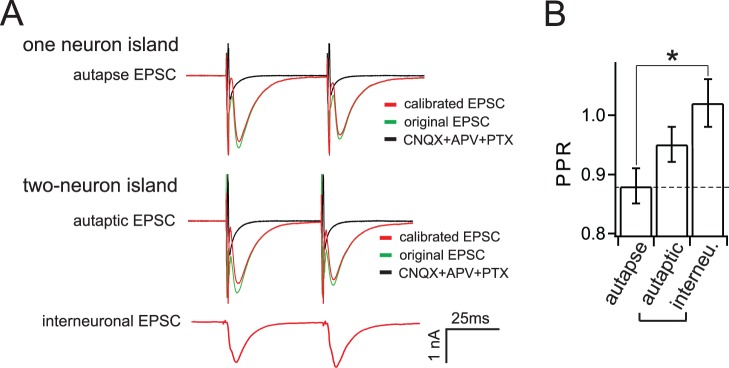
Figure 4. Interneuronal synapses display an enhanced paired-pulse ratio (PPR) compared to autapses.

(A) Representative paired-pulse EPSCs recorded from autapses and autaptic and interneuronal synapses in two-neuron micronetworks. The calibrated EPSC was calculated by subtracting the offset current, determined by stimulation in the presence of CNQX to block AMPA receptors, from the original EPSC. (B) The PPR, determined by dividing the second EPSC by the first, is larger in two-neuron micronetworks (autaptic: 0.95±0.03; interneuronal: 1.02±0.04) than in autapses (0.88±0.03). Interneuronal synapses exhibited the highest PPR (n = 18 autapses, 20 autaptic synapses, and 20 interneuronal synapses. Statistical significance was determined by one-way ANOVA and Newman-Keuls post-hoc test. *p<0.05. All data shown represent mean ± SEM.
