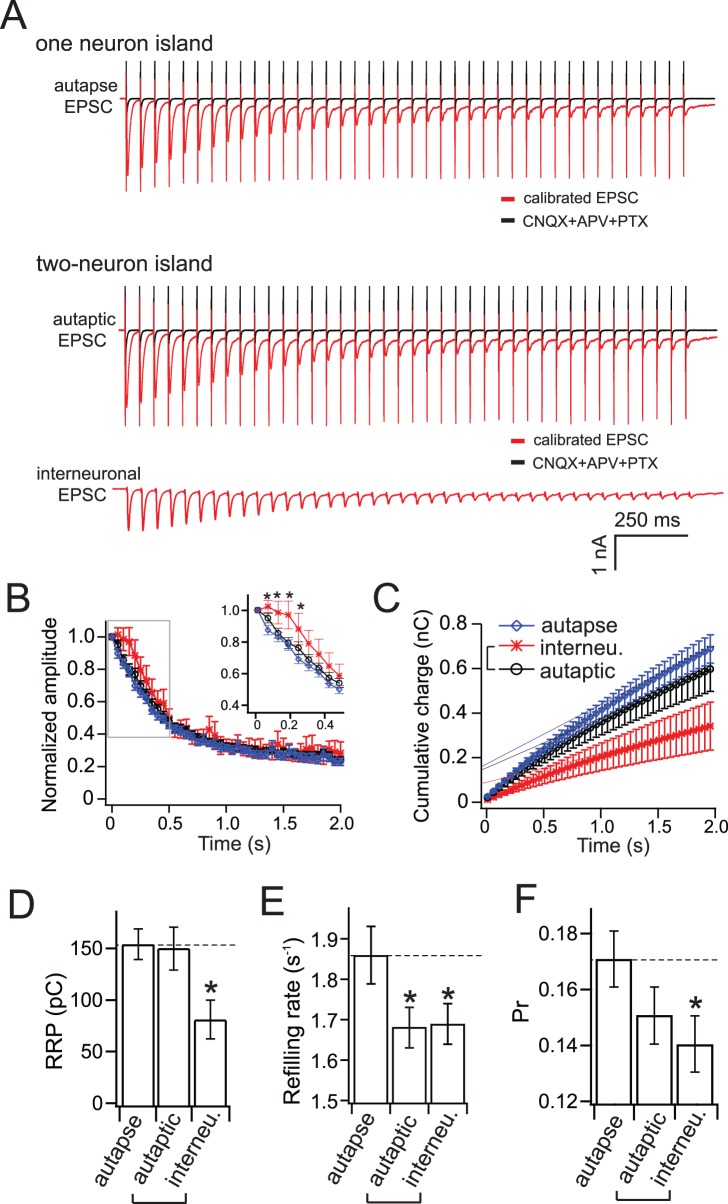
Figure 5. Synapses in two-neuron micronetworks display increased short-term plasticity, compared to autapses.
(A) Representative EPSCs triggered by high-frequency stimulation (HFS, 40 APs/2 s) of autapses and two-neuron micronetworks. Calibrated EPSCs were calculated by subtracting the offset current, determined in the presence of CNQX to block AMPA receptors, from the original EPSC. (B) The peak amplitude of each EPSC normalized to the peak of the first response and plotted versus time. Note that autapses and autaptic synapses underwent immediate depression after the first few APs, compared to interneuronal synapses. Inset is a magnification of the graph in the indicated box, showing the responses to the first 10 stimuli. (C) Plot of cumulative total charge versus time. Data points from the 30th to the 40th EPSC were fitted with a linear function. The y-intercept is a measure of the RRP size (D), and the slope divided by the RRP size (to eliminate any influence of different RRP sizes between groups) reveals the SV refilling rate (E). (D) The RRP size in interneuronal synapses is smaller (81.8±18.7 pC) than in autaptic synapses in two-neuron networks (150.3±20.5 pC) or in autapses (153.9±14.7 pC). (E) The synaptic vesicle refilling rates during HFS were significantly reduced in both interneuronal and autaptic synapses of two-neuron micronetworks (autaptic: 1.68±0.05 s−1; interneuronal: 1.69±0.05 s−1) compared to autapses (1.86±0.07 s−1). (F) Release probability (Pr) was determined by dividing the single EPSC charge by RRP size. Two-neuron micronetworks exhibited reduced release probability in both autaptic (0.15±0.01) and interneuronal synapses (0.14±0.01) compared to autapses (0.17±0.01); the difference between autapses and autaptic synapses was not significant (p = 0.063). Statistical significance was determined by one-way ANOVA and Newman-Keuls post-hoc test. *p<0.05, n = 18 (autapses), 20 (autaptic synapses), and 20 (interneuronal synapses). All data shown represent mean ± SEM.

