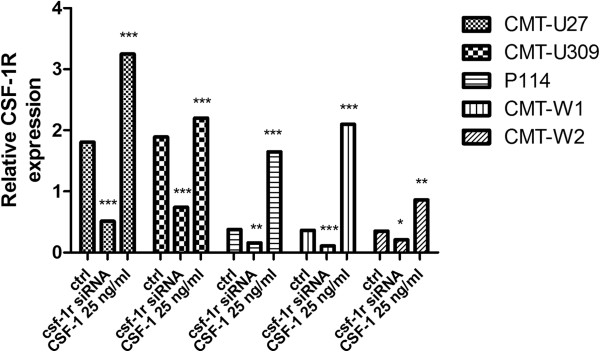
Figure 2.

Expression of CSF-1R at mRNA level. The relative gene expression level csf-1r in CMT-U27, CMT-U309, P114, CMT-W1 and CMT-W2 cell lines in control conditions, after siRNA transfection (to knockdown csf-1r expression) and CSF-1 treatment (25 ng/ml) determined using Real-time PCR. The results are presented as means from 3 experiments. Error bars refer to S.D. The statistical analysis was performed using Prism version 5.00 software (GraphPad Software, USA). The one-way ANOVA and Tukey HSD post-hoc test were applied. p<0.05 was regarded as significant and marked as *, whereas p<0.01 and p<0.001 was regarded as highly significant and marked as ** and ***, respectively.
