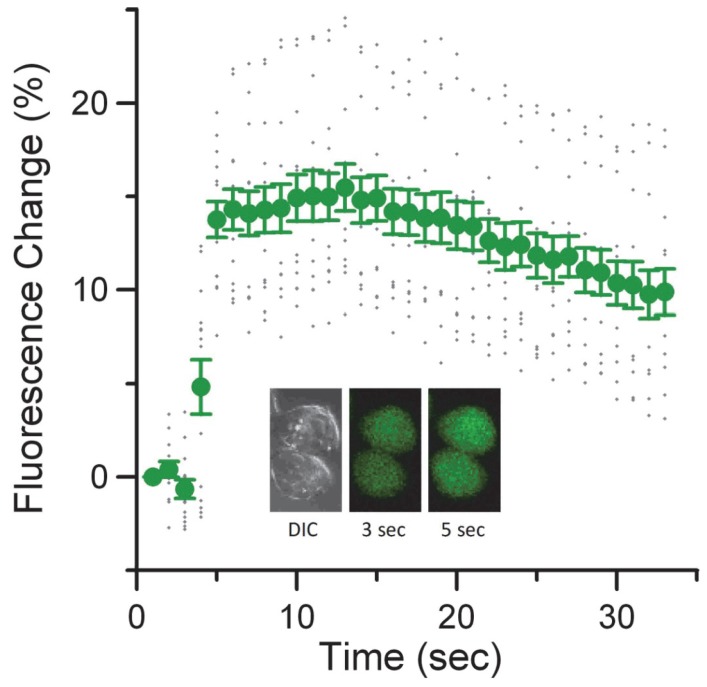
Figure 4. Rapid and sustained calcium influx following nsPEF exposure.
Graph depicts the average response of ten CHO-K1 cells upon exposure to a single 600 ns electric pulse at 1.8 MV/m applied field. Inset shows a representative response from two cells just before (3sec) and immediately after the pulse (5 sec). Errors bars represent the standard error of the mean.

