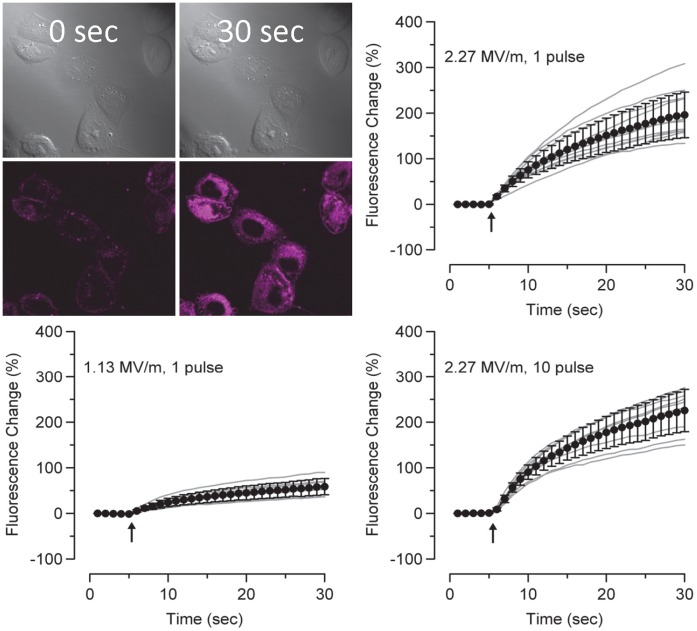
Figure 9. FM1-43 fluorescence change upon nsPEF exposure.
A representative image of FM1-43 uptake in cells exposed to 1, 600 ns pulse illustrated by considerable dye entering the interior of the cell observed under confocal microscopy. Traces of the whole cell fluorescence during nsPEF exposure show that one and ten pulses at 2.27 MV/m cause immediate uptake of FM dye into the cell. Single pulse exposures at 1.13 MV/m show a reduced but observable increase in FM1-43 fluorescence.

