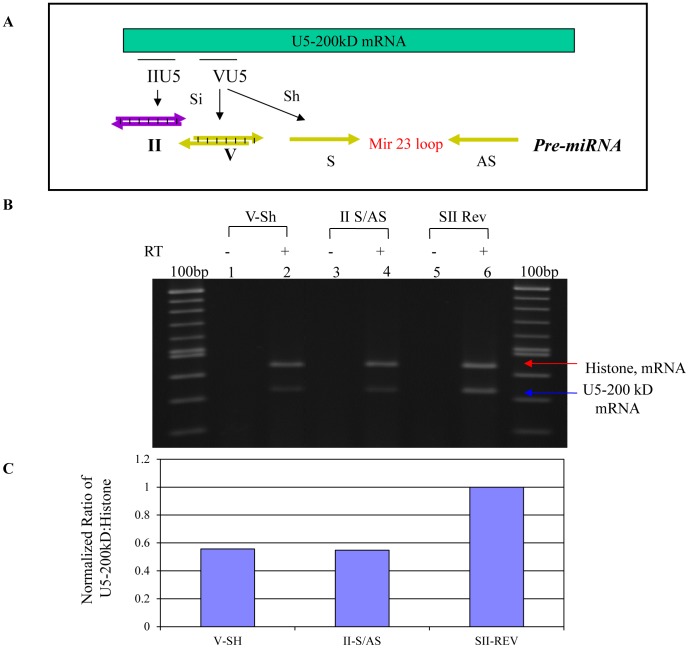
Figure 5. siRNA and shRNA knockdown of the U5-200kD mRNA.
A) Diagram of the site II siRNA and site V siRNA and shRNA targeting the N-terminal coding region of the U5-200kD mRNA. B) RT-PCR analyses of the 293/EcR cells transfected with anti-U5-200kD site II and V siRNAs and the irrelevant anti HIV-1 Rev siRNA. The lower band in lanes 2, 4 and 6 is the RT-PCR amplified endogenous U5-200kD mRNA. The upper band is the RT-PCR amplified endogenous H2A which was used to normalize the expression of the U5-200kD mRNA. Lanes 1, 3 and 5 represent the RT-PCR reactions without addition of reverse-transcriptase. C) Semi-quantitative analysis of the U5-200kD RT-PCR reactions. After normalizing the U5-200kD signal to the histone signal, the bar graph for both site V and II treated cells indicate approximately forty-five percent reduction of the U5-200kD mRNA in the total isolated cellular RNA. Considering that the transfection efficiency for this experiment was approximately fifty percent, we assume close to one hundred percent reduction of the target mRNA in the transfected cells. Both sites V and II siRNAs were effective in reducing the U5-200kD mRNA in the 293/EcR cells.

