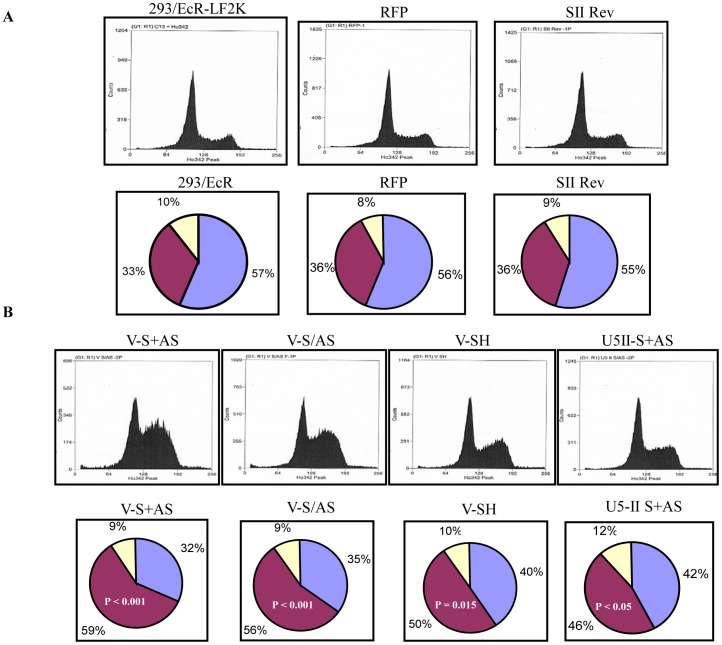
Figure 8. Cell cycle analyses of shRNA treated cells.
A) The upper panel (left to right) shows the 293/EcR cells mock transfected with lipofectamine 2000, transfected with DsRed2 plasmid and the irrelevant anti-Rev shRNA. The cell cycle distribution for these treatments was similar to untreated HEK 293 cells. The lower panel illustrates the cell cycle distribution of the control experiments. The 293/EcR mock transfected, DsRED2 plasmid transfected and irrelevant anti-Rev shRNA transfected cells have similar cell cycle distribution patterns to HEK293 cells. B) The upper panel (left to right) demonstrates the cell cycle distribution for 293/EcR cells transfected with anti-U5-200kD siRNA (2 plasmids), sense and antisense cassettes in one plasmid, the same site in short hairpin (shRNA) form as well as a second anti-U5-200kD siRNA (2 plasmid) targeting a different sequence in the U5-200kD mRNA. The V-S+AS, V-S/AS and V-Sh each encode siRNAs targeting the same anti-U5-200 kDa site but are expressed either as separate sense/antisense strands from two plasmids or a single plasmid, or as an shRNA. All three cell cycle distributions illustrate severe S phase arrest due to the knockdown of the U5-200kD target mRNA. The U5II-S+AS site confirms that the cell cycle distribution obtained from the first site is truly due to reduction of the U5-200kD helicase. The lower panel represents the cell cycle distribution of the U5-200kD specific siRNA and shRNA transfected cells. Compared to the control panel A, the percentage of cells in S phase has increased dramatically from 33–36% to 50–59% while the G2/M phase of the cell cycle remained unchanged.

