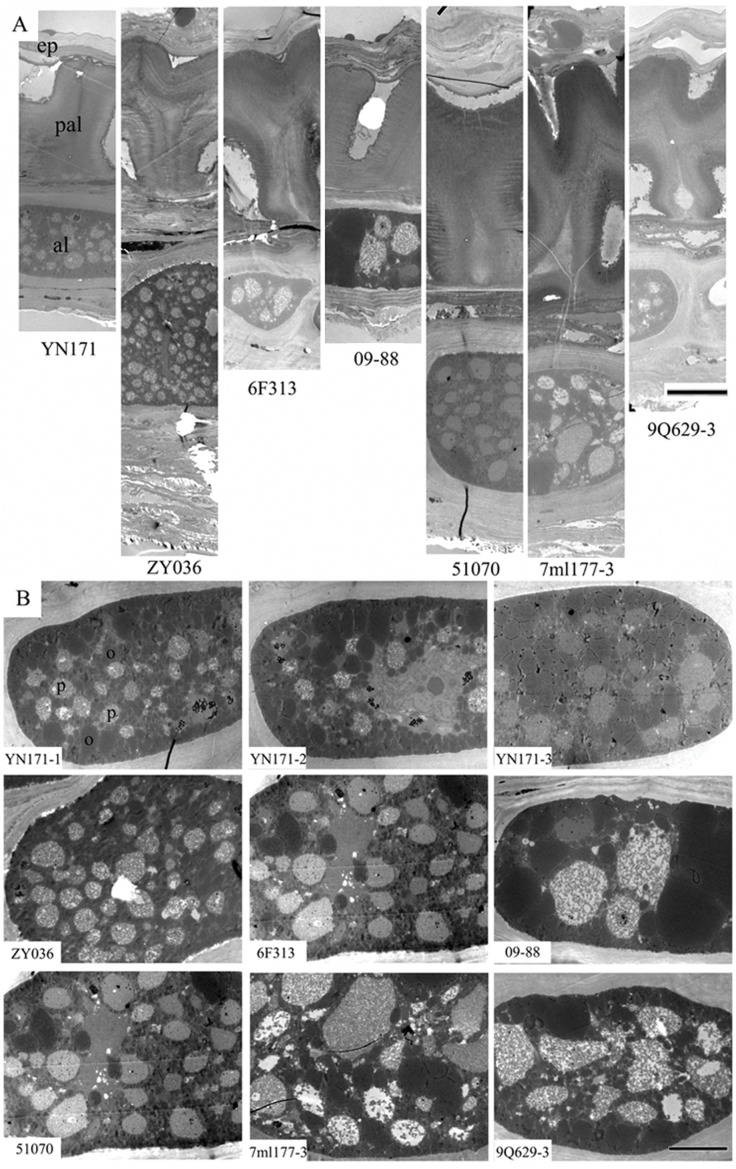
Figure 4. TEM analysis of 7 lines different oil content rapeseed seedcoats.
(A) Ultrastructure of seedcoat, showing the epidermis (ep), palisade (pal) and aleuronic layer (al). From left to right, YN171, ZY036, 6F313, 09–88, 51070, 7ml177-3 and 9Q629-3. (B) Ultrastructure of aleuronic cell in rapeseed seedcoat, showing the oilbodies (o) and protein bodies (p). The upper is the ultrahigh oil content line YN171 with three observations (YN171-1, YN171-2 and YN171-3), the middle is three high oil content lines ZY036, 6F313 and 09–88, the nether is three low oil content lines 51070, 7ml177-3 and 9Q629-3. Bars are 10 µm in (A) and 5 µm in (B).

