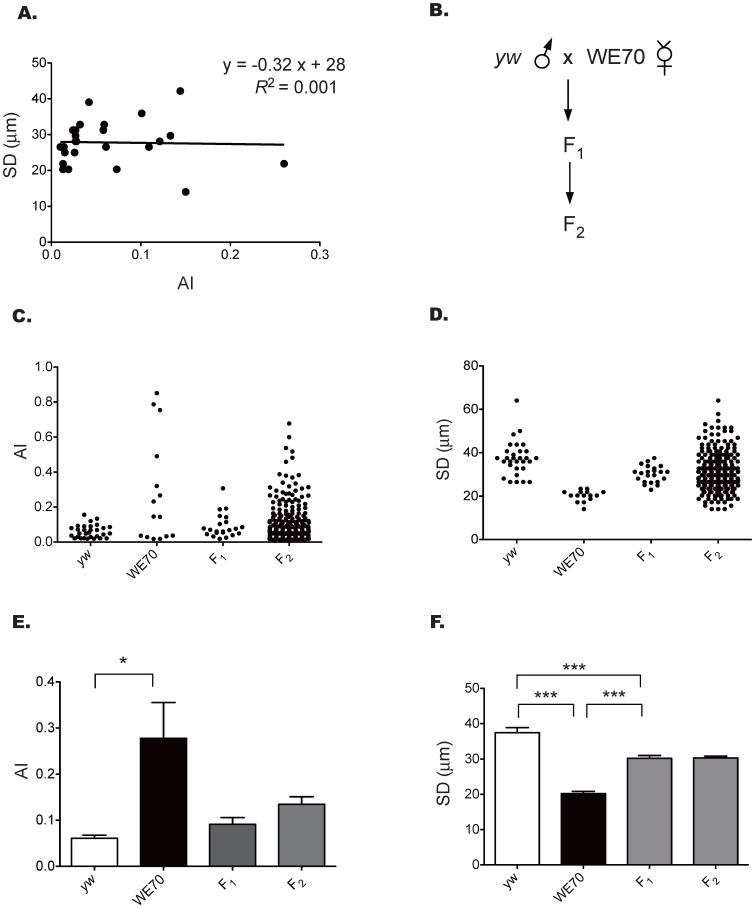
Figure 2. Phenotypic segregation in the WE70 × yw cross.
(A) No significant correlation overall between the arrhythmia index (AI) and the systolic diameter (SD) phenotypes in F2 progeny is observed (R2 = 0.001, F-test, p = 0.88). (B) Crossing scheme design between yw and WE70. (C, D) Distribution plots of AI and SD by genotype showing incomplete penetrance of elevated AI in WE70 and the dispersion of phenotypes in the F2 with approximately one-quarter aberrant flies. (E, F) Mean of AI and SD among WE70, yw, F1 and F2. The error bar is representing S.E.M. of each group. The significant differences in AI and SD between WE70, yw, and F2 are indicated (t-test, *p<0.05, **p<0.01, ***p<0.001).The F1 phenotype is intermediate between yw and WE70 for both AI and SD, but generally closer to yw.

