
Figure 1. Scatter plots of GC content and read coverage of real Illumina data.
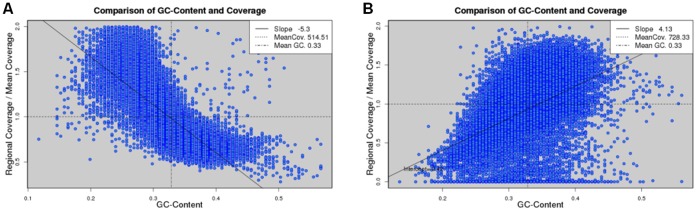
The data sets are from S. aureus USA300 (A) and S. aureus MRSA252 (B) genomes. Read coverage is normalized to the mean value, which is represented by a horizontal dashed line. A vertical dashed line denotes the mean GC content. The data points are fitted by a straight line and the slope is defined as the degree of GC bias. The two cases represent a negative and positive GC bias, respectively.