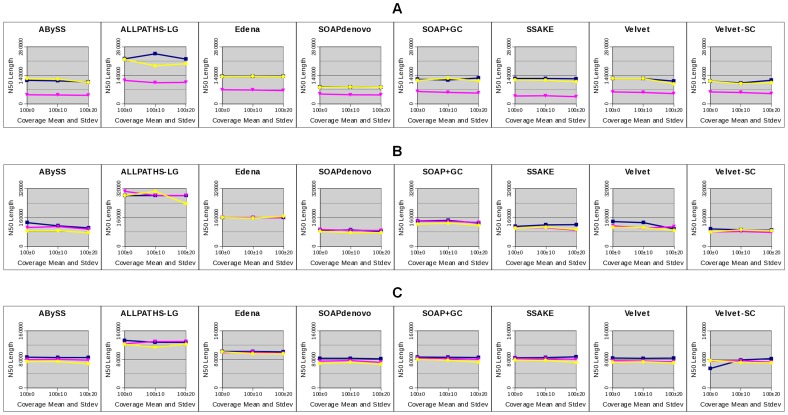
Figure 12. Corrected N50 length of assemblies at three background fluctuations.
We show the corrected N50 length in eight assemblies of three bacterial genomes: E. coli (A), S. aureus (B), and M. tuberculosis (C), using simulated data at three degrees of background fluctuations (x-axis), each at three degrees of GC bias: negative (yellow), zero (dark blue), and positive (pink).

