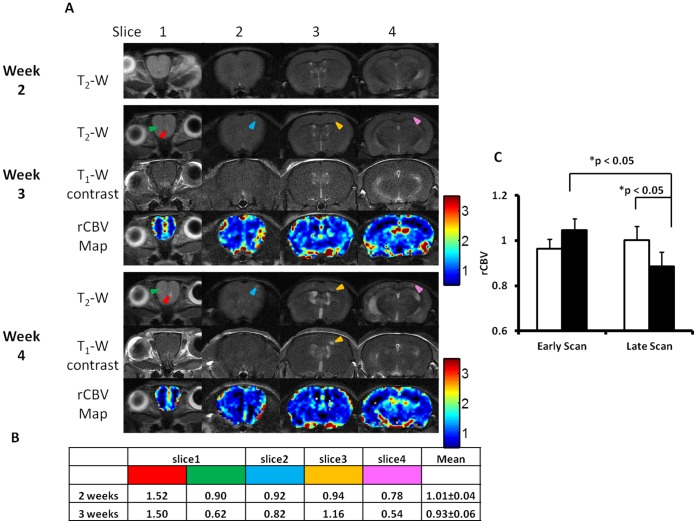
Figure 5. Longitudinal MRI study of changes in BTB permeability and rCBV of brain metastases.
A. Longitudinal MRI of a representative mouse brain was initiated 2 weeks after intracardiac injection of 231Br cells. At week 3, five small metastases (arrowhead) were identified on four consecutive T2-weighted coronal images. At week 4, many more lesions appeared on T2-weighted coronal images, while all the 5 lesions seen on week 3 were found to increase in size (arrowhead). Changes in BTB permeability and rCBV were then evaluated for these five lesions. There was initially no contrast enhancement seen in the five tumors at week 3, indicating an intact BTB. All the tumors except one (yellow arrowhead) still kept BTB intact at week 4. rCBV maps were created and rCBV values of the tumors were presented in the table (B). C. A total of 32 lesions in 5 animals were seen on both scans of weeks 3 and 4. rCBV of brain metastases (solid) was initially similar to that of contralateral normal brain (open; mean = 1.05±0.05 (se) vs. 0.96±0.04), but decreased significantly (p<0.05) and became significantly lower as compared to their contralateral normal brain in the late scan (mean = 0.88±0.06 vs. 1.00±0.06; p<0.05).

