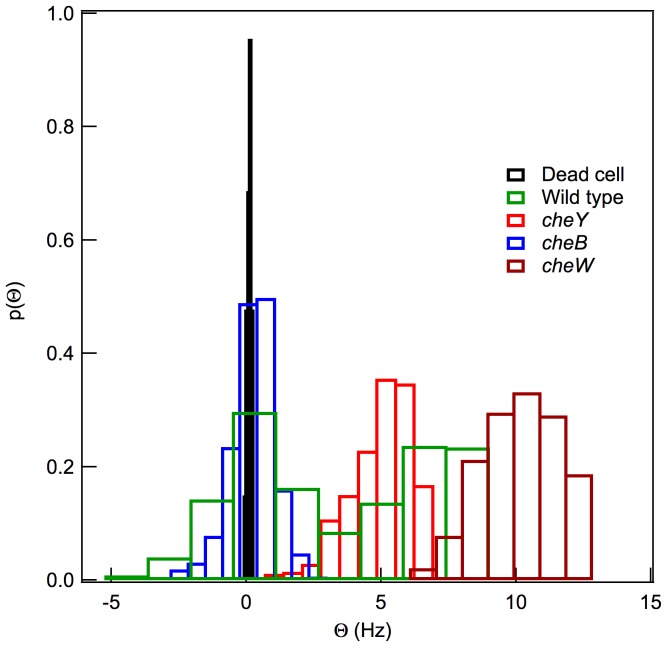
Figure 8. The slope,  , of the CCF near
  obtained from the trajectories of single optically trapped dead (diamonds), running (circles and crosses, corresponding to
  and
and  mutants, respectively),
  mutant tumbling (squares), and wild-type (triangles) bacteria.
The histograms of the distributions can be classified into three main groups: (1) The histograms with a single maximum centered at zero that corresponds to tumbling bacteria ( mutant); (2) those with a single maximum not centered at zero correspond to a deterministic rotation associated with the rotation of a solid sphere, as is the case for running bacteria (
 and
and  mutants); and (3) a combination of both profiles, as occurs in the wild-type strain.

