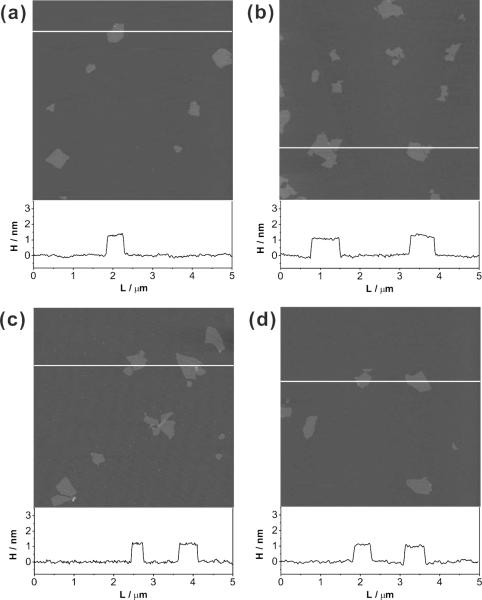
Figure 2.
AFM topographic images of graphene oxide nanosheets with C/O ratios of (a) 1.1, (b) 1.3, (c) 1.6, and (d) 1.9 demonstrating that the sheets in all the samples are similar in sample sizes and thicknesses. The height profiles for the white lines in each AFM image are included below the panels. A color reproduction of this figure is available in the SI as Figure S8.

