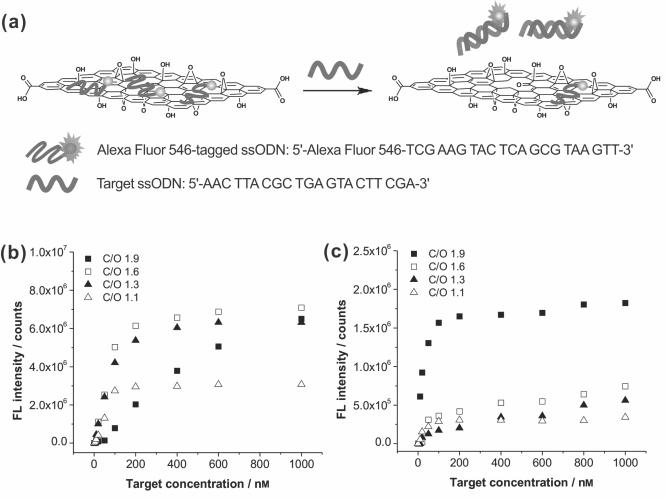
Figure 4.
(a) Schematic illustration of the hybridization between target ssODNs and the Alexa Fluor 546-tagged capture ssODNs that have been pre-complexed with a graphene oxide sheet, leading to restoration of the quenched fluorescence from the dyes after 1 h of incubation. (b and c) Plots of corrected fluorescence intensity at emission maximum wavelength of Alexa Fluor 546-tagged ssODNs coupled with the graphene oxide nanosheets (5 μg/mL) in 20 mm Tris-HCl buffer solution (b) and FBS (c) as a function of the concentration of the target ssODNs. The graphene oxide samples have C/O ratios of 1.1 (△), 1.3 (▲), 1.6 (□), and 1.9 (■). For each plot, measured fluorescence intensity data were corrected by subtracting against the baseline solution fluorescence prior to the addition of target DNA. In Tris-HCl buffer, the recovered fluorescence signal for the least-oxidized sample still did not reach saturation after 1 h, suggesting that there are still more ssODNs being bound to the surface. A color reproduction of this figure is available in the SI as Figure S10.

