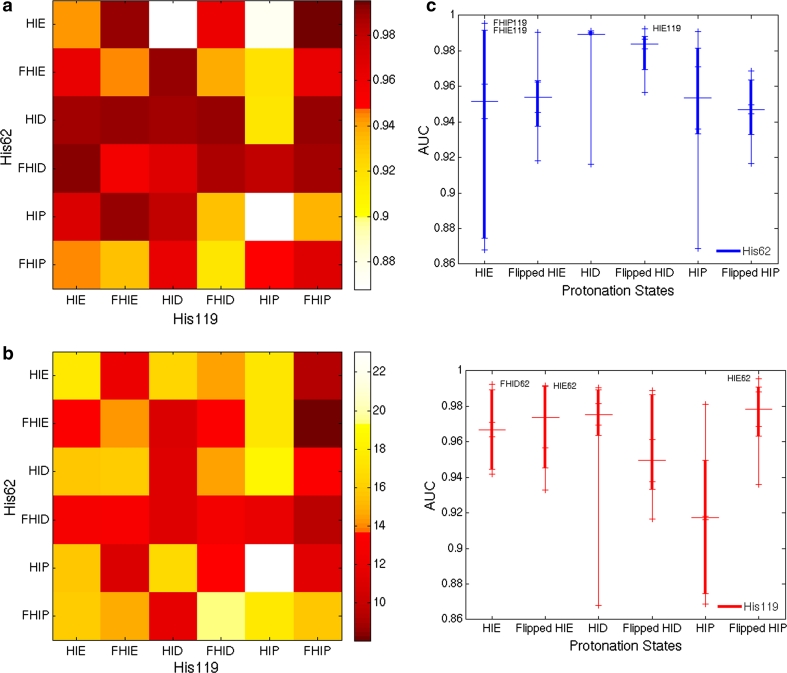
Fig. 4.
a AUC values of 36 receptor models. Protonation and rotameric states are marked for each histidine. Flipped states are marked with the letter F. Darker color indicates higher AUC and better predictive performance of the corresponding receptor model. b Average hydrogen bond percentage of the top 1 % compounds in 36 VS runs. Protonation and rotameric states are marked for each histidine. Lighter color indicates higher hydrogen bond percentage, with % unit for the colorbar. The R2 for the correlation between the AUCs and average hydrogen bond percentage for each VS run is 0.42 (see Online Resource 4 for the scatter plot). c Receptor performance dependence on His62 (top) and His119 (bottom). The median of the AUC values of each protonation state is shown with large horizontal line. The small ticks in each histidine model mark six different protonation states of the other histidine. The thicker vertical lines represent 25–75 % range of the AUCs. The best receptor models are shown explicitly with the models’ protonation states

