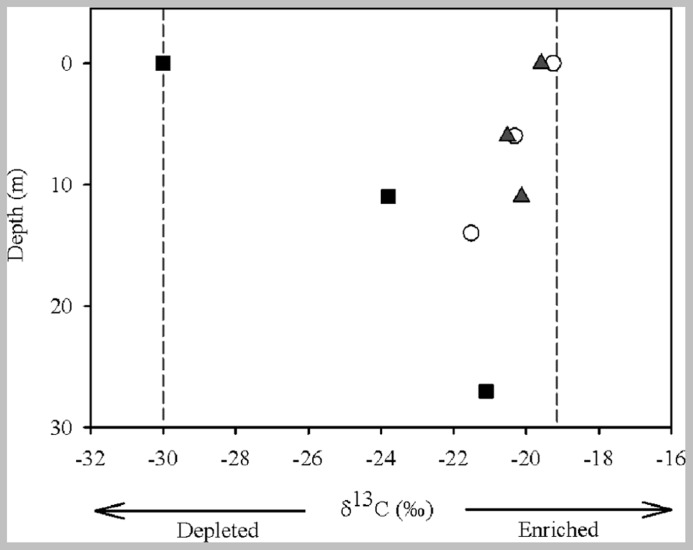
FIGURE 2.
Carbon isotope composition of the POM from the water sampled at different depths (surface, middle, and bottom) and in different zones (river = open circle, transition = gray triangle, and dam = black square) of the Manso Reservoir. Light gray lines represent the end members (allochthonous: δ13C -19.26‰ and autochthonous: δ13C -30.10‰).

