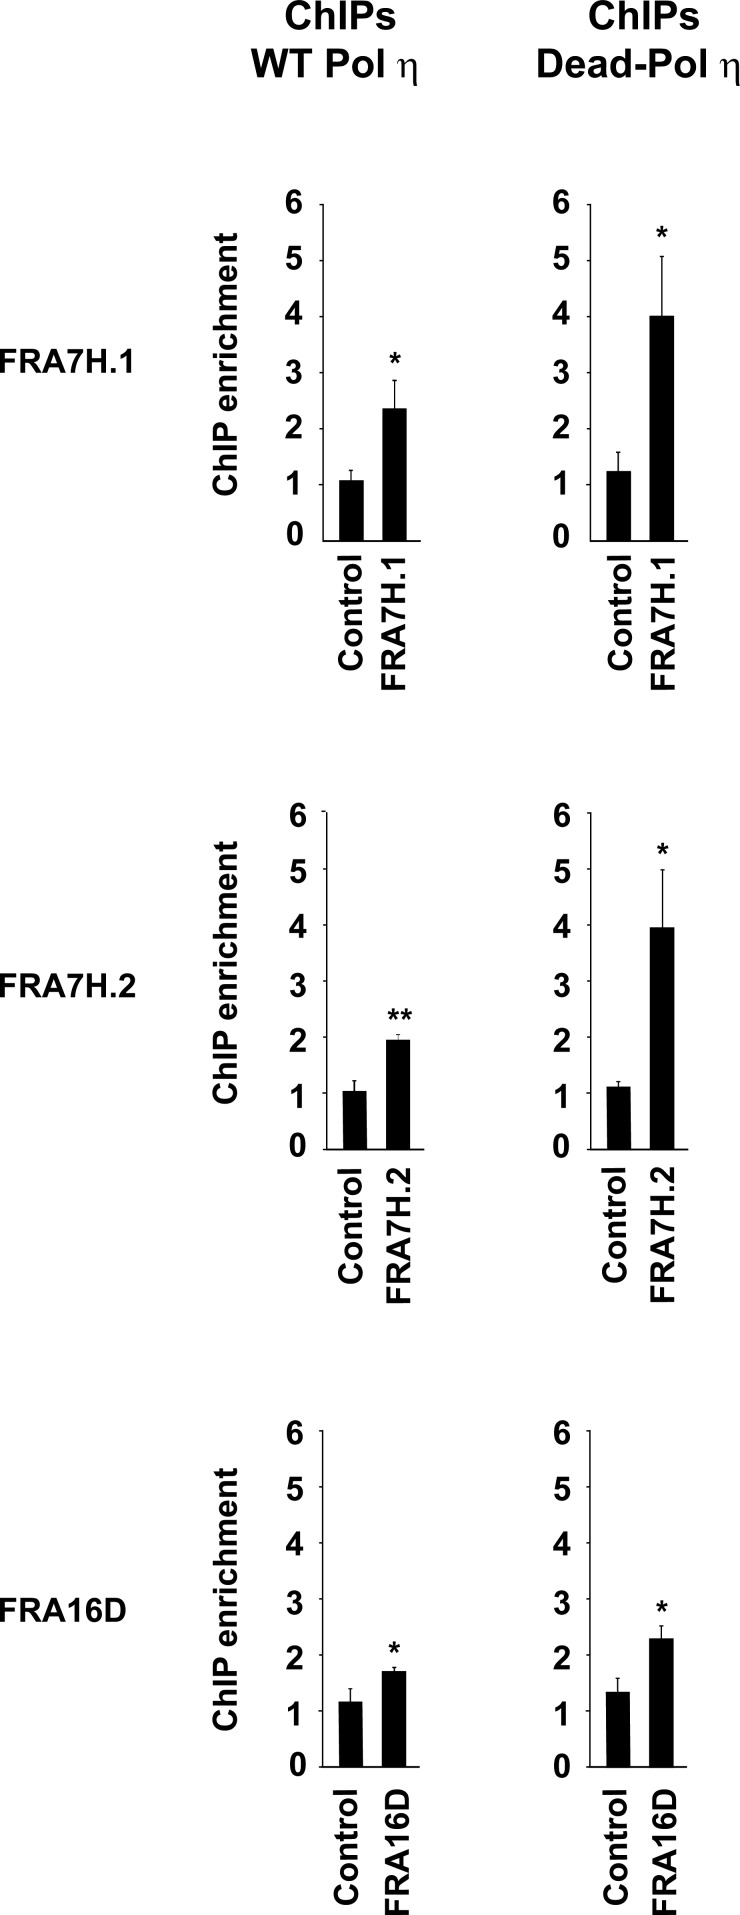
Figure 1.
Pol η accumulates at CFSs after replication stress. U2OS cells stably expressing WT Pol η (left panels) or Dead-Pol η (right panels) were exposed to 0.2 µM APH for 24 h and analyzed by chromatin immunoprecipitation (ChIP) followed by quantitative PCR for accumulation of WT Pol η and Dead Pol η at the indicated CFSs (FRA7H.1, FRA7H.2, and FRA16D) or control genomic regions (DHFR, GAPDH). Fold increase of chromatin immunoprecipitation (ChIP) over input DNA was calculated as a ratio between mock and Pol η for each replicate. Data are presented as mean values of three independent experiments ± SEM. The statistical significance of Pol η enrichment at CFSs in comparison to DNA control region was assessed using t test. P-values for ChIPs were as follows: P = 0.033 for FRA7H.1; P = 0.004 for FRA7H.2; P = 0.048 for FRA16D (WT Pol η) and P = 0.030 for FRA7H.1; P = 0.023 for FRA7H.2; and P = 0.021 for FRA16D (Dead-Pol η).

