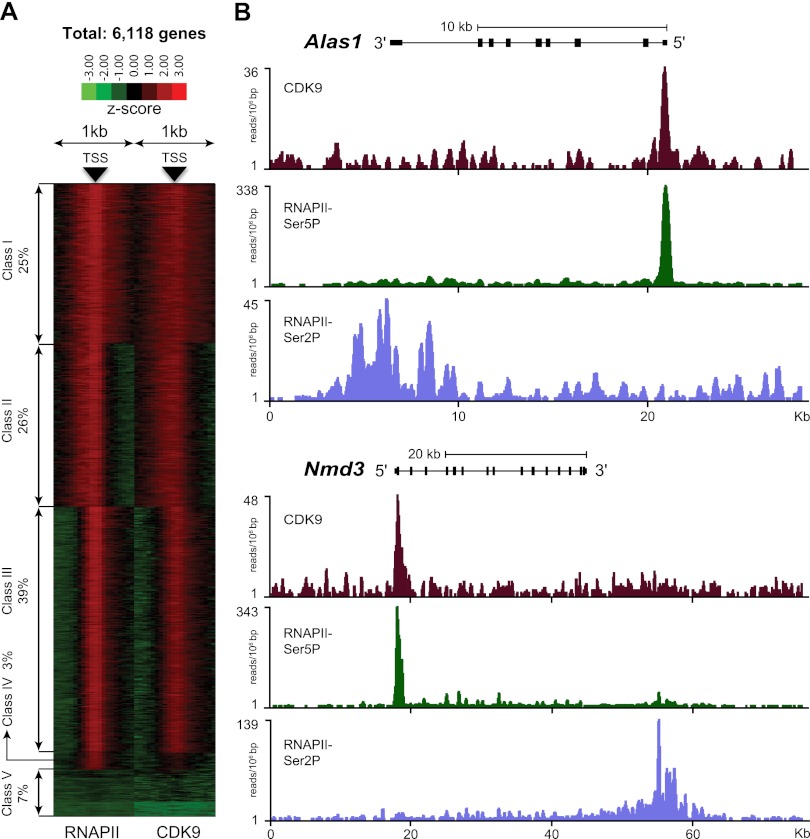
Figure 1.
CDK9 and RNAPII co-occupy the promoter-proximal region of transcribed genes. (A) Clustering of RNAPII (left) and CDK9 (right) binding in a window of ±1 kb relative to the transcription start site (TSS) of 6618 expressed genes in erythroid cells. This analysis shows five different classes of expressed genes. In 90% of the genes (classes I, II, and III), the pattern of binding of the two proteins relative to the TSS is very similar. In 3% of genes (class IV), a high level of RNAPII but a low level of CDK9 was detected. Seven percent of genes (class V) did not show significant binding of RNAPII and CDK9. (B) Binding of CDK9, RNAPII-Ser5P, and RNAPII-Ser2P on two representative genes. CDK9 and RNAPII-Ser5P co-occupy the promoter-proximal region, whereas RNAPII-Ser2P is enriched in the 3′ ends of genes.

