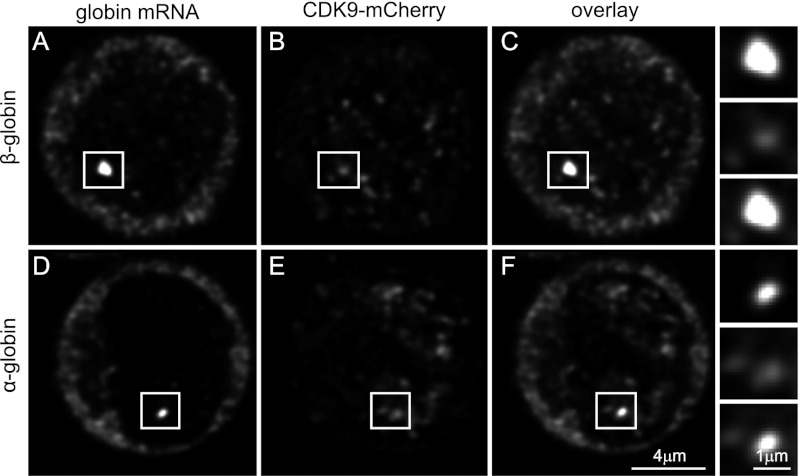
Figure 6.
CDK9 foci mark transcription sites. Confocal image projection of a 3D image stack of RNA-FISH-stained fetal liver cells isolated from a CDK9-mCherry knock-in 14.5-d-post-coitum (dpc) embryo. β-Globin (A–C) and α-globin (D–F) RNA staining (A,D) with CDK9-mCherry fluorescence (B,E). Overlay images (C,F) show a large overlap of globin transcripts and CDK9-mCherry fluorescence in the nucleus.

