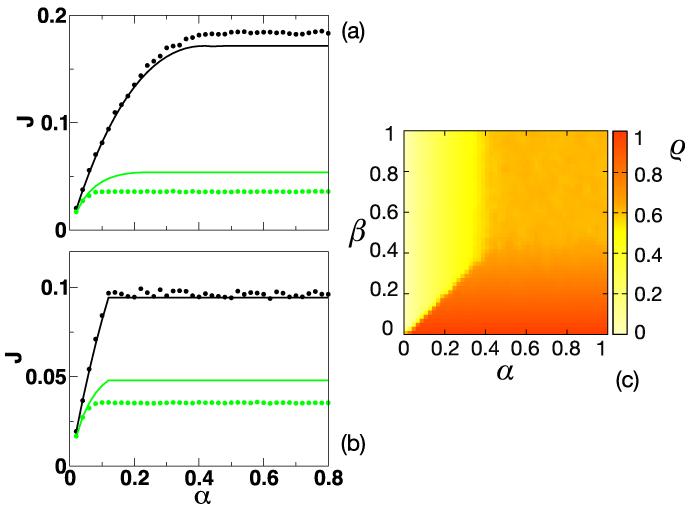
FIG. 9.
(Color online). Monte Carlo simulations. Panels (a) and (b) show the current J as a function of α in (a) systems passing from LD to MC (β = 1) and (b) from LD to HD phase (β = 0.12). Full lines represent the theoretical predictions and circles are simulation points (k = 1 in black and k = 0.1 in green - light gray). The value of γ is fixed to 1. Panel (c) shows the numerical phase diagram (different colors represent different densities ρ) for a system with k = γ = 1. Drawing the phase diagram for other values of the parameters, we reproduce the features illustrated in Fig. 8.

