
FIG. 2.
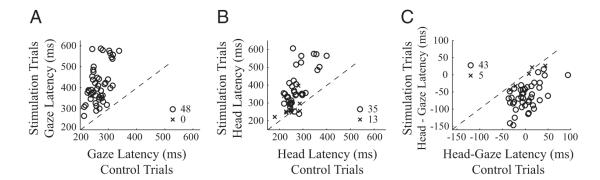
The effect of stimulation of the OPN region on latency. Gaze latency (A), head latency (B), and head-gaze (C) onset times are compared for stimulation vs. control conditions when stimulation was triggered before gaze onset. A negative value of head-gaze latency indicates that the head movement preceded gaze onset. Each point represents a dataset (n = 48). Statistically significant datasets (○), based on a rank-sum test (P < 0.05) are differentiated from nonsignificant datasets (×). - - -, unity slope.