
FIG. 5.
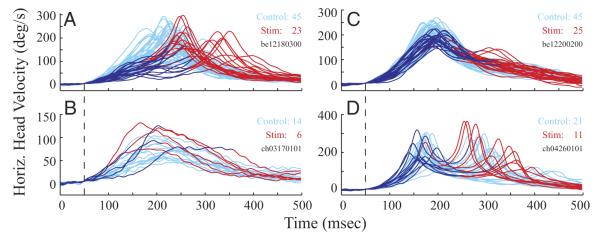
Temporal evolution of horizontal head velocity. Each panel shows control (cyan) and stimulation (red, blue) trials aligned on head onset, marked by the vertical dashed lines. A and B: data from 2 datasets for which stimulation was delivered before gaze onset. The component of head movement that preceded gaze onset in each stimulation trace is shown in blue; this epoch corresponds to the interval marked by the vertical dashed lines in Fig. 3A. The remainder of the trial is shown in red. C and D: data from 2 datasets for which stimulation was triggered on gaze onset. For each stimulation trial, the interval from initial gaze onset to resumed gaze onset is overlaid in blue; the rest of each trial is shown in red. These datasets were chosen to illustrate cases where stimulation did (top) and did not (bottom) attenuate the head movement.