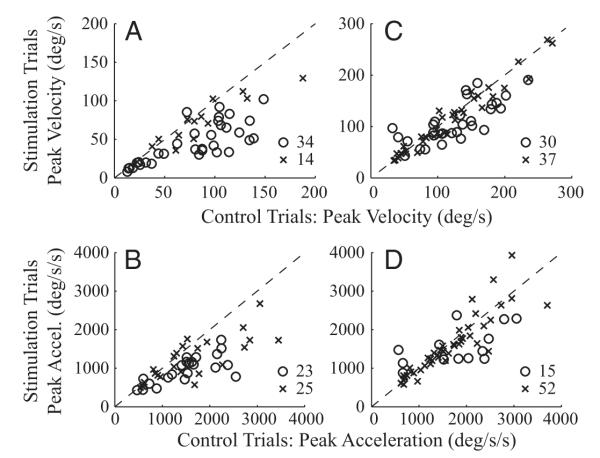
FIG. 7.
A comparison of peak head velocity (A and C) and peak head acceleration (B and D) in the control and stimulation conditions. The peak value was computed across the “blue” component of each stimulation trace (Figs. 5 and 6) and the same interval of an averaged control movement. The control and stimulation values for each dataset were averaged and compared across all datasets. Thus each point corresponds to one dataset. Statistically significant datasets (○), based on a sign-rank test (P < 0.05), are differentiated from nonsignificant datasets (×). - - -, unity slope. Left and right: data represent the conditions when stimulation was delivered before and after gaze onset, respectively.

