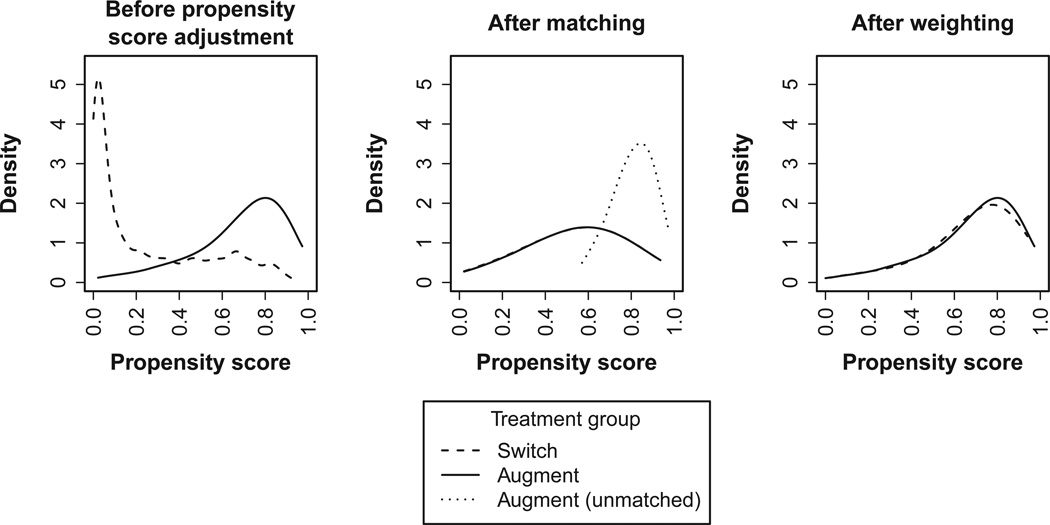
Figure 1. Propensity Score Distribution in the Augment and Switch Groups Before Propensity Score Application, After Matching, and After Weighting.
The figure, based on kernel density estimation, shows distributions of propensity scores estimated using logistic regression. Horizontal axes indicate ranges of propensity score values. Weights are for the treatment effect in the medication augmentation group.

