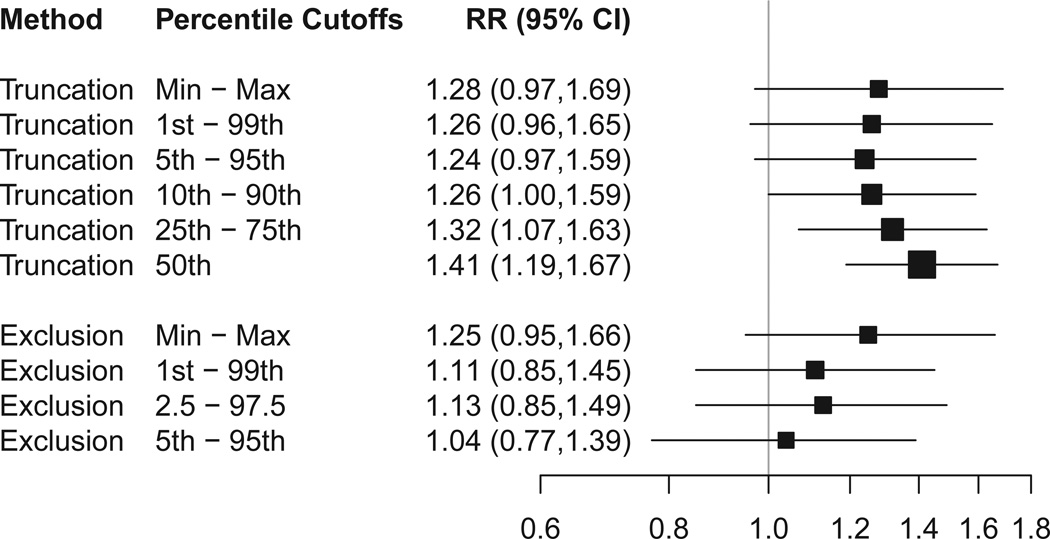
Figure 2. Sensitivity of Weighted Estimates to Truncation of Weights and to Exclusion of Observations with Extreme Propensity Scores.
CI=confidence interval; RR=risk ratio. The figure shows RRs for remission based on estimated propensity scores that were applied using standardized mortality ratio weights. Percentile cutoffs are relative to the propensity score distribution in the medication switch group. Truncation means that weights below the lower cutoff were increased to equal the lower cutoff, and weights above the higher cutoff were decreased to equal the higher cutoff. Exclusion means that observations outside the indicated range were omitted from the analysis. Box size indicates relative precision. Lines indicate 95% confidence intervals.

