
Figure 1.
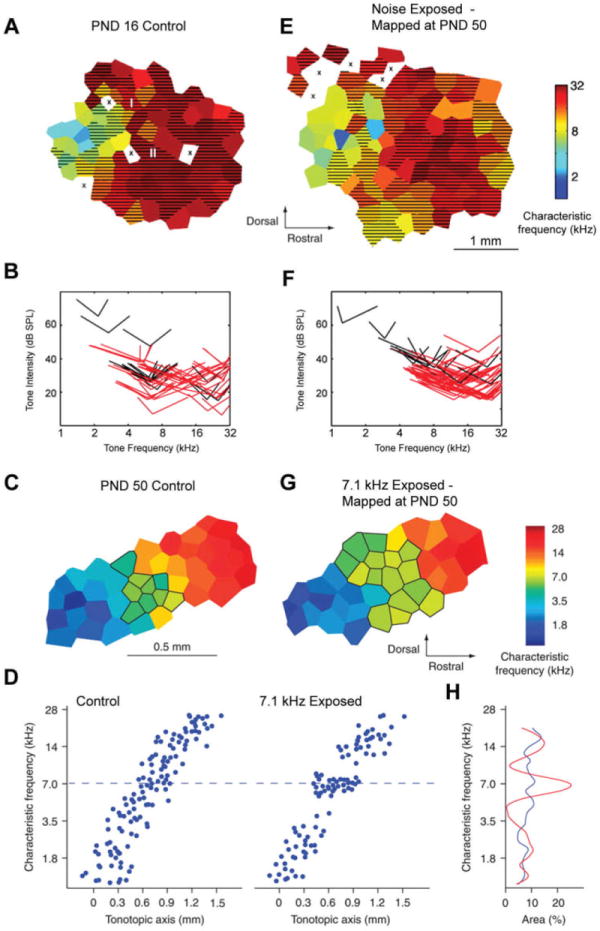
Tonotopic map development in normal and abnormal auditory environments. Representative characteristic frequency (CF) maps from auditory cortex of a PND 16 rat (A), a naïve adult (C), a PND 50 young adult reared in continuous white noise (E), and a young adult rat reared in the presence of pulsed 7.1 kHz tones (G). Neurons sampled from the hatched areas had frequency tuning bandwidths measured 20 dB above threshold (BW20s) greater than 1.5 octaves (A and E) Neurons in outlined areas had characteristic frequencies in a range of 7.1 kHz ± 0.2 octaves (C and G). X = unresponsive sites. Note difference in scale bars between top and bottom pairs of maps. B and F: Receptive fields recorded from maps shown in A and E. Distribution of BW10 tuning curve tips from each map, illustrating the CF threshold, and BW10s recorded at each penetration. Red tips denote BW10s greater than 1.5 octaves, D: Characteristic frequency distribution along the tonotopic axis in control and 7.1 kHz-exposed groups. Note the clustering of characteristic frequencies near 7.1 kHz in the 7.1 kHz-exposed animals. H: Percent primary auditory cortex area representing frequencies in a 0.4 octave frequency band. The representations of 7.1 kHz ± 0.2 octaves were significantly larger in tone-exposed animals (red) than they were in control animals (blue). The data shown in panels A, E, B, and F are from Chang and Merzenich (2003). The data shown in panels C, G , D, and H are from Han et al (2007).