
Figure 2.
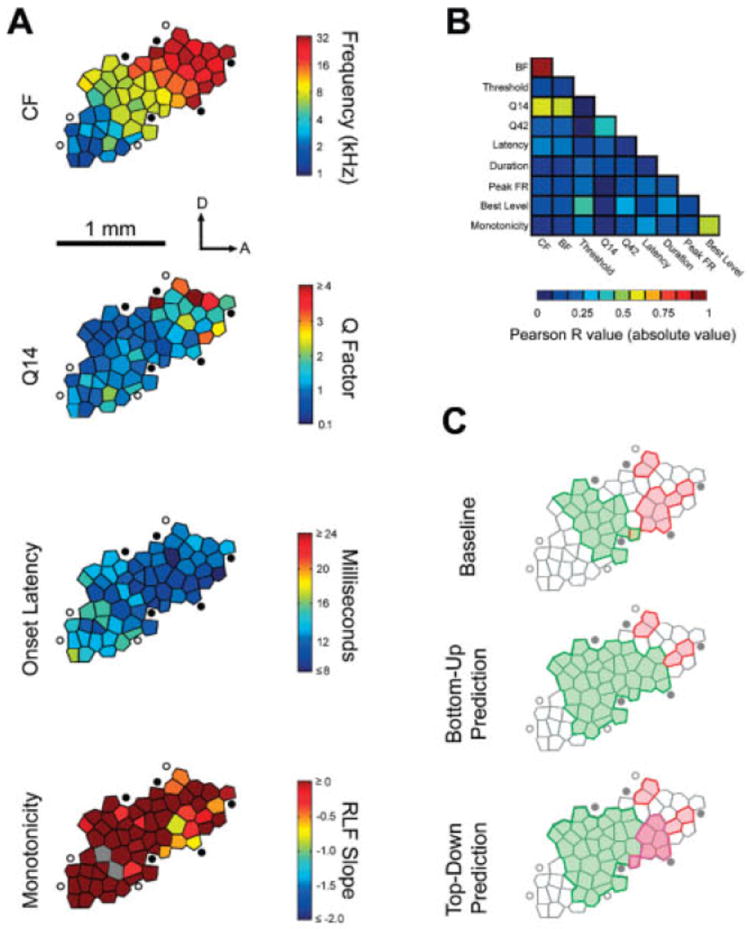
Spatial organization of multiple response features within A1. A: Representative A1 map from a naïve adult. The color of each polygon corresponds to the color scale bar for each response feature shown to the right. D and A correspond to dorsal and anterior, respectively. Filled circles indicate unresponsive sites. Open circles represent sound-responsive sites outside A1. Gray polygons indicate sites for which the response parameter of interest could not be calculated. Q14 = the quality factor (CF/bandwidth) measured 14 dB above minimum response threshold. RLF slope = the slope of the rate-level function; more negative values correspond to sites with nonmonotonic intensity-tuned response functions, B: Mutual correlation matrix for ten response features measured in A1 indicating: the absolute value of the Pearson R correlation coefficient for all unique pairs of variables. Note that related response characteristics (e.g., BF and CF or best level and monotonidty) covaried among themselves but not with the other groupings of response characteristics. C: Schematic of the A1 map shown in A illustrating cortical areas preferring midfrequency tones (green polygons) and low intensity tones (red polygons). Relative the pretraining baseline, an adult rat trained o t respond selectively to midfrequency tones would exhibit an expansion of the midfrequency CF representation. The maps below depict the possibility that intensity characteristics of midfrequency tones, though irrelevant to the task, would also be reflected i n the pattern of reorganization (bottom-up prediction), Alternatively, the plasticity could be restricted only to the stimulus dimension that is relevant to the demands of the task (top-down prediction). The data in panels A and B are from Polley et al, 2007.