
Figure 3.
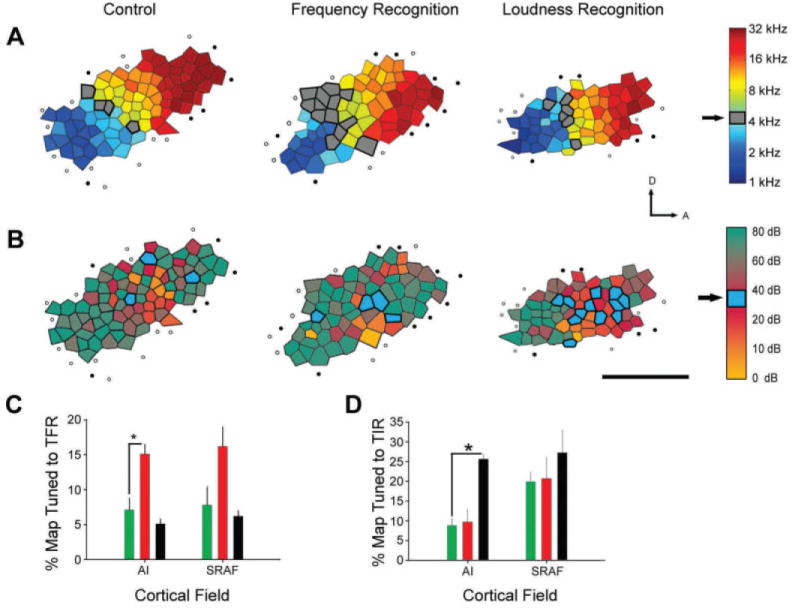
Task-specific functional reorganization in adult rat A1. Maps for CF (A) and best level (B) are presented for a representative naïve control (left column), a representative rat trained in a frequency recognition task (middle column), and a representative rat trained in a loudness recognition task (right column). A: Gray shaded polygons indicate recording sites with CF values within the trained frequency range (5 kHz ± 0.375 octaves). Filled circles indicate unresponsive sites. Open circles represent sites with sound-driven responses that did not meet the criteria for inclusion in A1. Scale bar = 1 mm. The arrows indicate dorsal (D) and anterior (A) orientations, respectively. B: The same conventions as in A, except that the color within each polygon indicates the best level for neurons at that recording site, rather than CF. Empty polygons indicate recording sites where a best level could not be determined. Blue shaded polygons indicate recording sites with best-level values in the trained intensity rage (35 ± 5 dB SPL). C: Percent of map area within A1 and a secondary auditory field, SRAF, allocated to the trained frequency range (TFR) in naïve control rats (green), rats trained in the frequency recognition task (red), and rats trained in the loudness recognition task (black), D: Percent of map area within A1 and SRAF allocated to the trained intensity range (TIR). Color conventions are the same as C. Asterisks indicate statistically significant differences between groups (p < 0.05). The data are from Polley et al (2006).