
Figure 4.
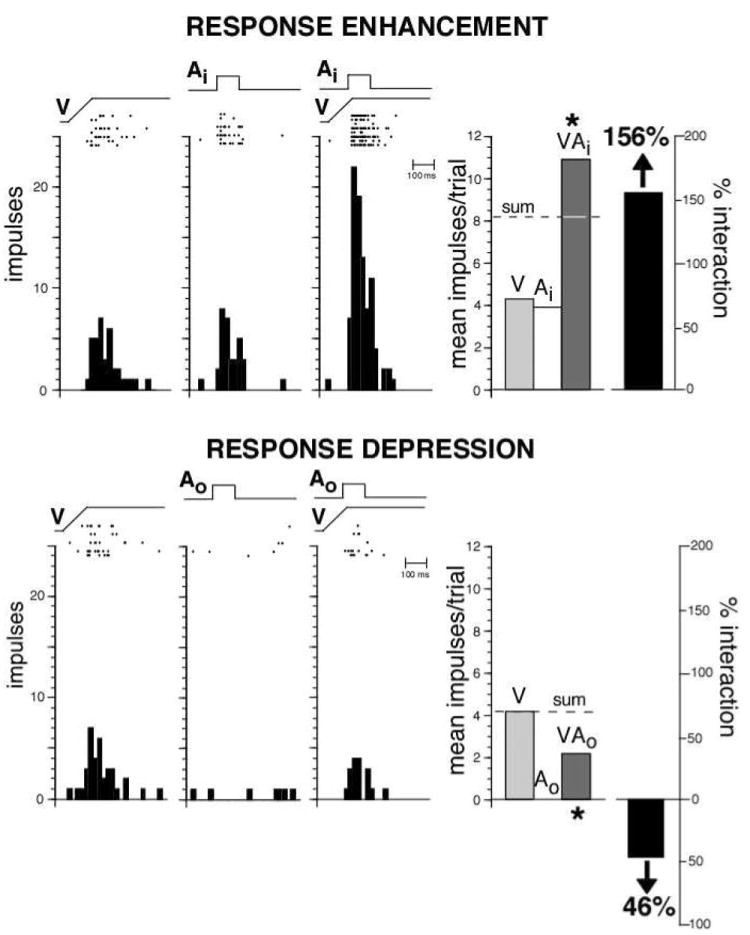
Multisensory integration can be divided into two broad operational categories. Response enhancement (top) represents a gain (i.e., increase) in response upon presentation of stimuli in multiple modalities. Rasters and peristimulus time histograms on the left depict the responses of a single multisensory neuron to a visual stimulus alone (V), to an auditory stimulus alone (Ai), and to the combined presentation of these stimuli. Ramps and square waves show the relative timing of the stimuli. Summary bar graphs on the right plot this neuron’s mean response to each of these conditions, as well as the relative gain in response (i.e., 156%) to the multisensory combination. Note that the percent interaction is calculated in this example as [(VAi − V)/V] × 100. In addition, note that, the multisensory response exceeds that predicted by a simple addition of the component unisensory responses. Response depression (bottom) represents a decline in response relative to the best unisensory condition. Here we see that the presentation of an auditory stimulus outside of its receptive field (Ao—contrast this with the Ai condition shown above) results in a significant decline in the visual response.