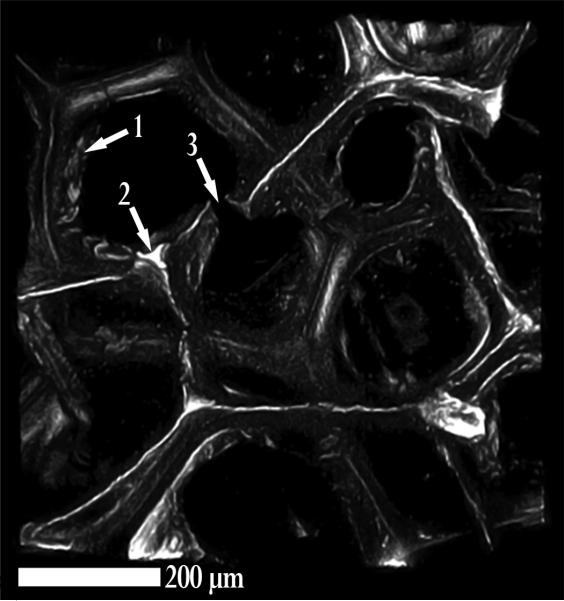
Figure 7.
A 3D confocal image of a polyurethane low density foam based on the H60 composition of [35] llustrates the pore network, a reticulated membrane (arrow 1), strut crossection (arrow 2), and a damaged strut (arrow 3) of the polymer foam. The resolution of the technique is approximately 1,1,5 micrometers (x,y,z: z depth). The scale bar is 200 μm.

