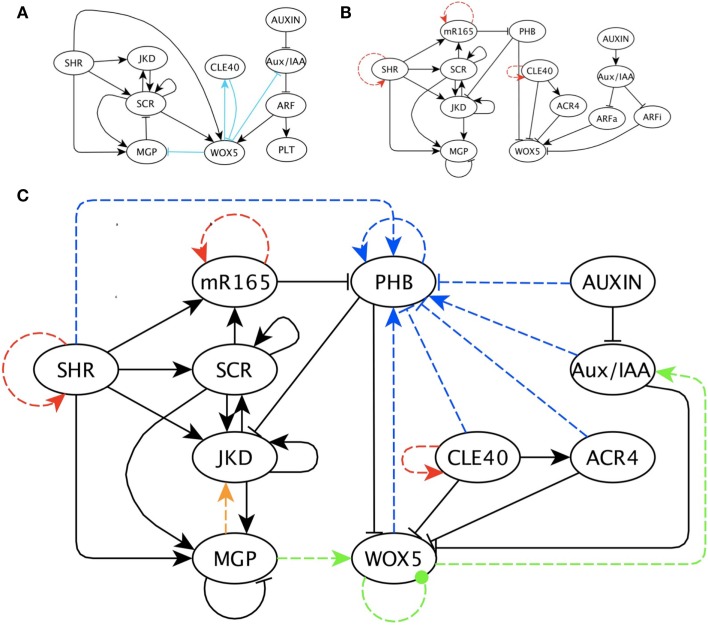
Figure 3.
The previous and updated RSCN GRN with predicted missing interactions. (A) Previously published RSCN GRN (Azpeitia et al., 2010). The light blue edges indicate previous predicted missing interactions. (B) Updated RSCN GRN as explained in the main text. The red edges are the self-regulations introduced to represent protein movement. (C) RSCN GRN with predicted missing interactions. For simplicity and clarity, intermediary nodes were not included in this GRN; however, these nodes are available in Supplementary Material. Yellow, green and blue edges are the three predicted interactions required to recover the expected attractors and are grouped according to the node’s functions. The blue edges always indicate regulation of PHB. The yellow edge is a positive regulation of JKD by MGP. The green edges correspond to regulation of WOX5. The dotted green edge indicates a negative or positive regulation of WOX5 by itself.

