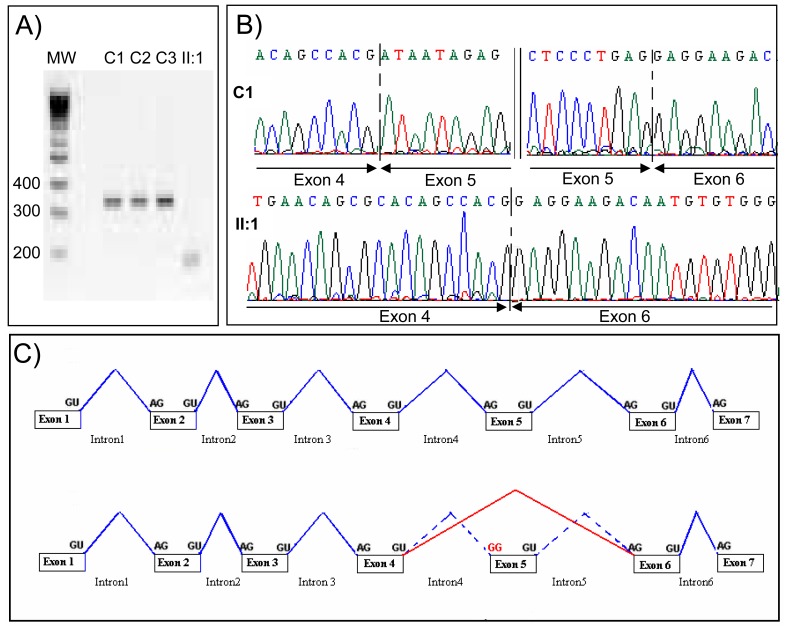
Figure 3. Transcript analysis from control subjects from the general population (C1-C3) and patient II:1, [c.436-2A>G, c.144delC].
A) Electrophoresis showing the RT-PCR amplification of AURKC exon 4-6. Controls C1-C3 yield a normal fragment of 329bp and patient II:1 a shortened fragment of 180bp devoid of exon 5. B) Electropherogram showing the exons boundaries of the bands showed in pannel A. Sequence analysis indicates that exons 4-6 are present in control C1 whereas exon 5 is removed from II:1 transcript. C) Illustrates the exon 5 skipping as observed in patient II:1.

