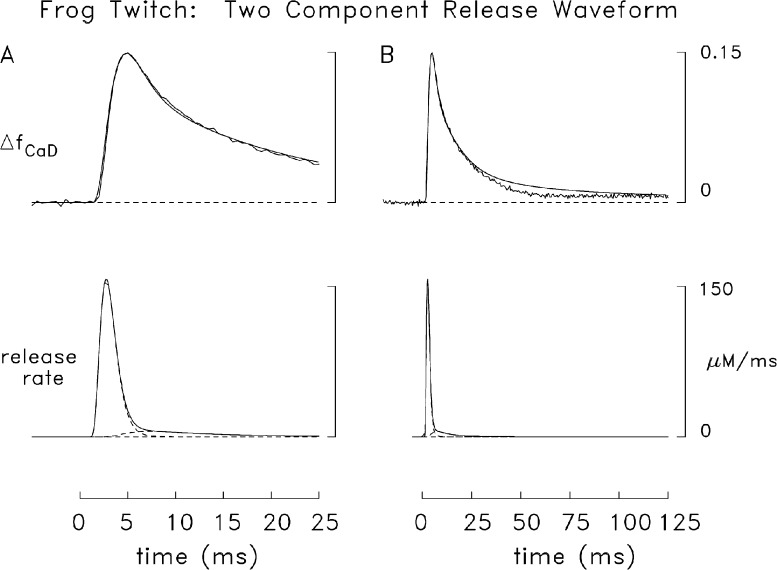
Figure 7.
Comparison of simulated and measured frog ΔfCaD signals. (A) Comparison like that in Fig. 6 B except that the theoretical release function is the sum of two components (broken traces), each of which has the functional form of Eq. 3. The values of release amount, τ1, and τ2 are 335 µM, 1.5 ms, and 0.65 ms (first component); and 56 µM, 1.7 ms, and 7 ms, respectively (second component); the onset of the second component is assumed to lag that of the first component by 1 ms (T in Eq. 3 is 1 ms for the first component and 2 ms for the second). The peak value, time of peak, and FDHM of the composite release waveform are 157 µM/ms, 2.7 ms, and 2.0 ms. (B) Same traces as in A but on a fivefold slower time base.

