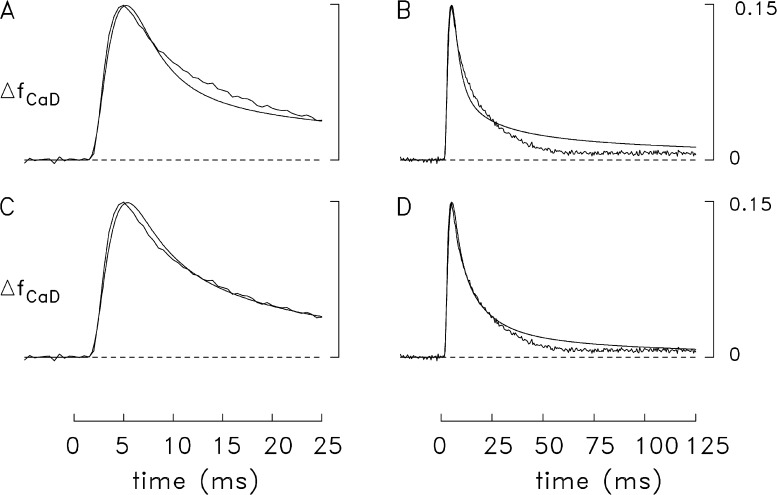
Figure 9.
Results of frog simulations with a single-component Ca2+ release waveform and changes in parameter values for parvalbumin and ATP. (A) Comparison like that in Fig. 7 but with the concentration of parvalbumin sites reduced from 1,500 to 750 µM. The values of release amount, τ1, and τ2 are 317 µM, 1.75 ms, and 0.7 ms, respectively. The FDHM of the simulated ΔfCaD waveform is 8.3 ms. (B) Same traces as in A but on a fivefold slower time base. (C and D). Comparison like that in Fig. 7 but with the concentration of ATP increased from 8 to 15 mM. The values of release amount, τ1, and τ2 are 399 µM, 1.7 ms, and 0.7 ms, respectively. The FDHM of the simulated ΔfCaD waveform is 10.1 ms.

