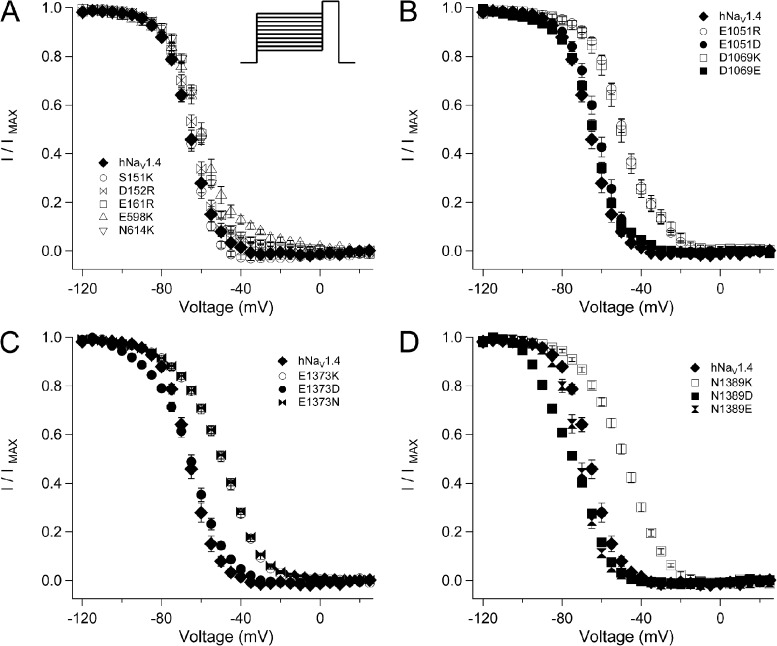
Figure 3.
Steady-state fast inactivation in hNaV1.4 and for ENC mutations. Channels were conditioned to voltages ranging from −120 mV to +25 mV for 300 ms before test pulses to 30 mV. I/V relations (h∞ curves) are shown for ENC mutations in domain I and domain II (A), domain III (B), domain IV S1 (C), and domain IV S2 (D). Values represent mean ± SEM (error bars) from 10–21 experiments.

