Figure 6.
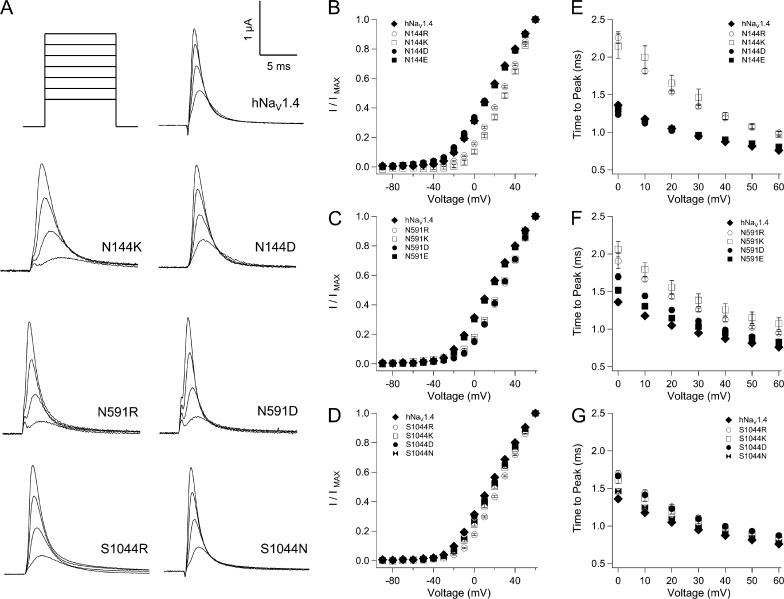
Activation parameters for mutations at S1 HCR locus in hNaV1.4. (A) Traces shown are responses to depolarization to 0 mV, 20 mV, 40 mV, and 60 mV for mutations in domains I–III. Plots in B, D, and F show I/V relations for mutations in these domains; plots in C, E, and G show activation kinetics. Values represent mean ± SEM (error bars) from 11–24 experiments.

