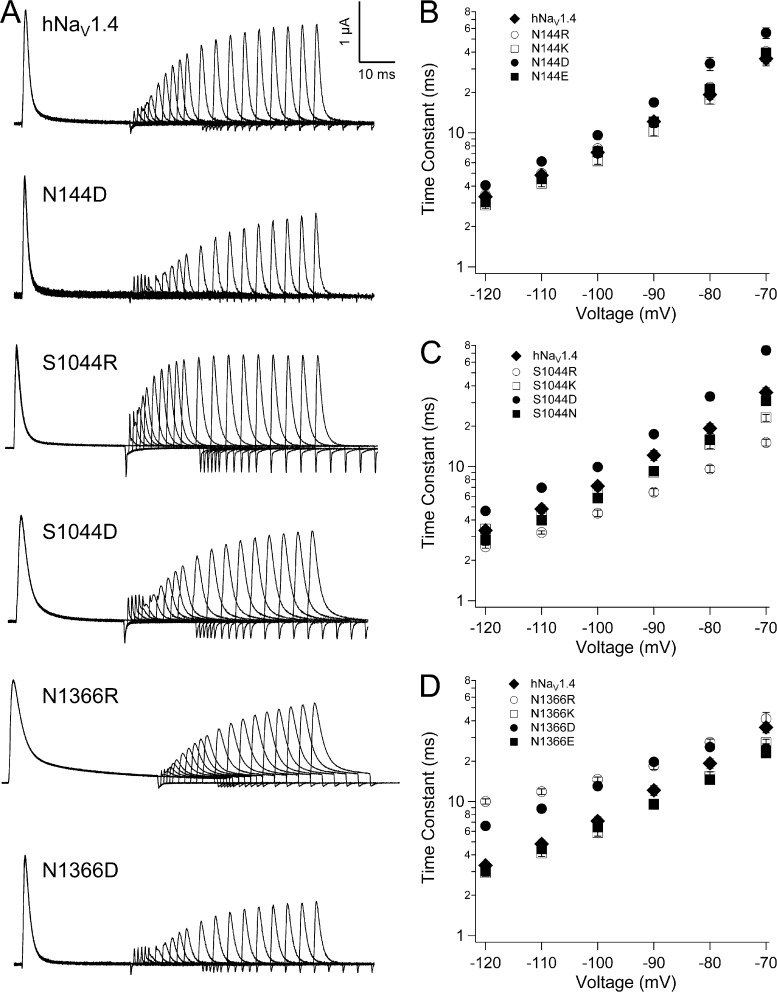
Figure 9.
Recovery from fast inactivation for HCR mutations. (A) Traces showing inactivating and recovery sweeps for hNaV1.4 and select aspartate or arginine substitutions in domains I, III, and IV. (B–D) Kinetics of recovery at voltages from −120 mV to −70 mV for mutations in these domains. Values represent mean ± SEM (error bars) from 10–22 experiments.

