Figure 3.
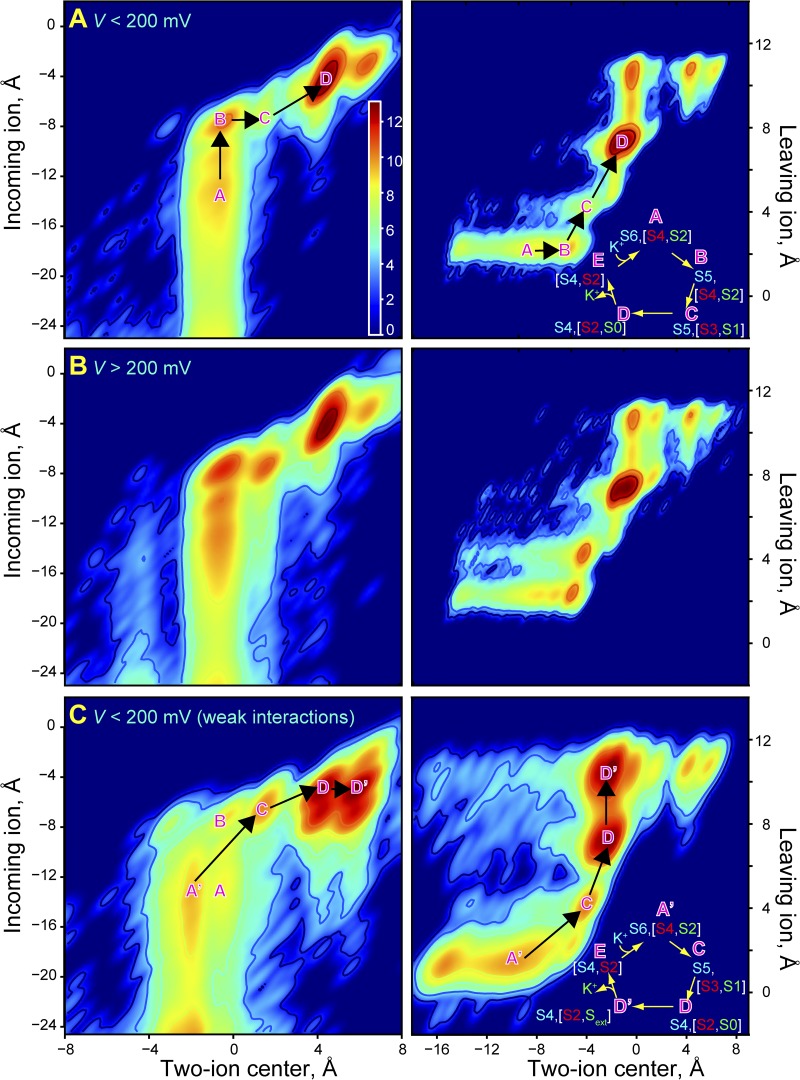
KV1.2/2.1 permeation mechanism. (A and B) Position of the incoming ion versus the centroid of the two SF-bound ions above it (left panels) and position of the leaving ion versus the centroid of the two SF-bound ions below it (right panels) at low (A) and high (B) voltages. The color bar is in units of log(ρ[x,y]); ρ[x,y] is the two-dimensional histogram of ion positions averaged over either low- or high-voltage simulations. The minima represent the four predominant three-ion configurations in the knock-on permeation mechanism; the mechanism is indicated in A (right), with S0–S6 denoting SF ion-binding sites (see Fig. S1). The knock-on intermediate is S5[S4,S2]; its formation is the rate-limiting step in the indicated mechanism (Jensen et al., 2010). (C) Low-voltage data similar to those in A, but obtained with weakened K+–carbonyl oxygen interactions (Roux and Bernèche, 2002; Allen et al., 2006b). The predominant permeation mechanism, in which the knock-on intermediate is not formed, is shown in the right panel.

