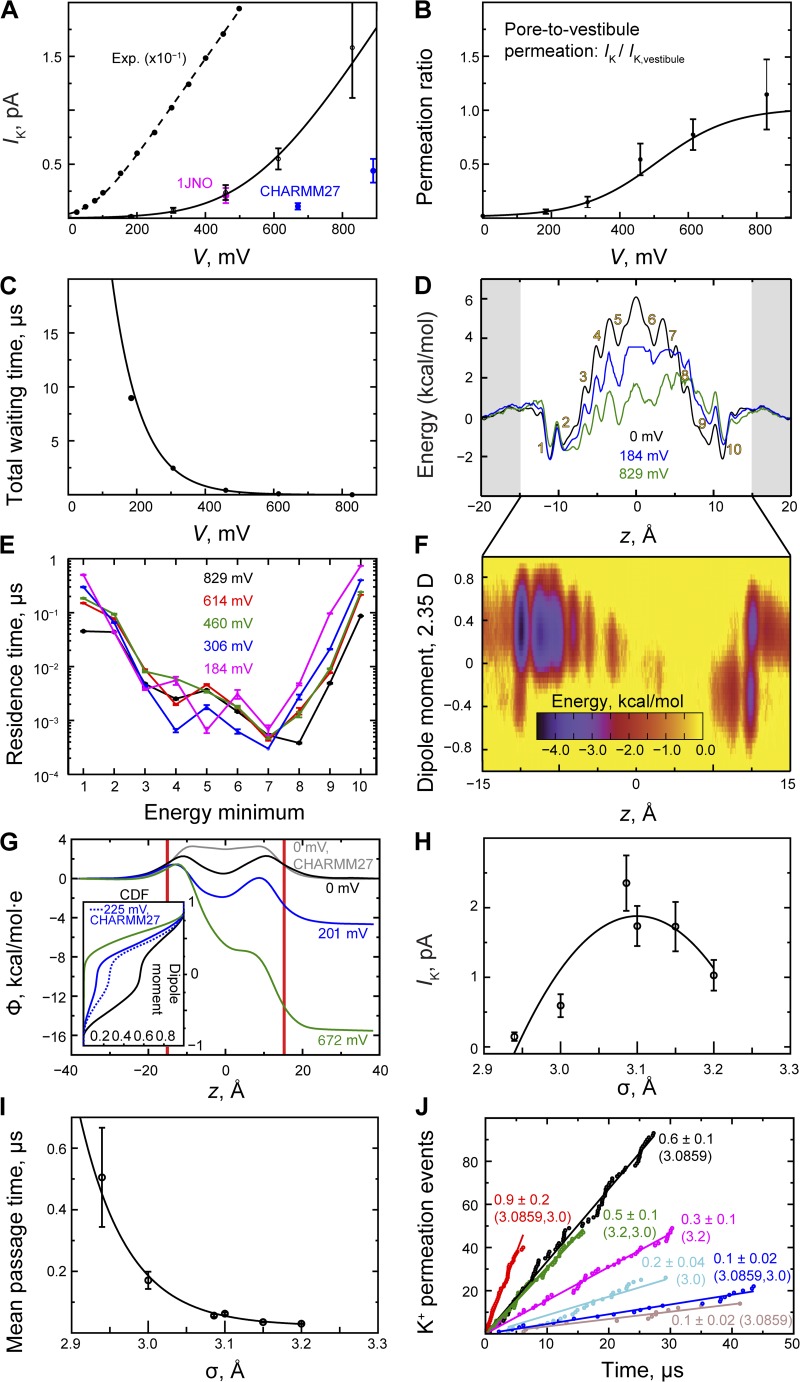
Figure 4.
Permeation in gA. (A) gA current–voltage relationship. K+ current; fits (black lines) of the I-V curves were performed as described in Materials and methods (see also the Fig. 2 A legend). The temperature-adjusted (to 310 K) experimental data are from Andersen (1983). A slope conductance of 66 pS was derived from these currents measured up to 500 mV. (B) Ratio of pore permeation to vestibule permeation (IK/IK,vestibule). (C) Total waiting time between two permeation events. (D) PMF, W(z), of K+ permeation as a function of ion position, and two biased energy profiles obtained at low and high voltage (see Materials and methods). K+-binding sites are labeled 1–10; sites 1, 2 and 9, 10 comprise the pore vestibules. (E) K+ residence binding-site times (see D). (F) Two-dimensional (biased) energy profile (kcal · mol−1). The average contribution per pore water molecule to the z component of the dipole moment as a function of ion position within the pore. The dipole moment is given in units of the TIP3P water dipole moment (2.35 D; Jorgensen et al., 1983), so it may take values between +1 and −1. The concerted water reorientation step, which changes the dipole moment from −0.4 to +0.4, occurs toward the end of the ion transfer at z ≈ 12 Å. (G) Electrostatic potential (Φ(z)) computed from ∼5-µs trajectories at zero, low, and high voltage with zero ion concentration; Φ(z; V = 0) obtained with CHARMM27 lipid parameters is shown for comparison. Inset is a cumulative distribution function (CDF) of the total water dipole moment. (H) K+ current shown as a function of σ. (I) K+ pore mean passage time versus the LJ parameter, σ. (J) K+ permeation obtained with different σ values. By assigning vestibule and lumen different K+–carbonyl oxygen interaction strengths (i.e., different σ parameters), a twofold increase in current (red) relative to the native interaction strength (black) could be observed at high voltage (∼646 mV), whereas a smaller increase occurred at lower voltage (∼300 mV); currents (in pA) are shown next to each permeation curve; the (dual) σ value(s) is shown here in parentheses (see Table S2).

