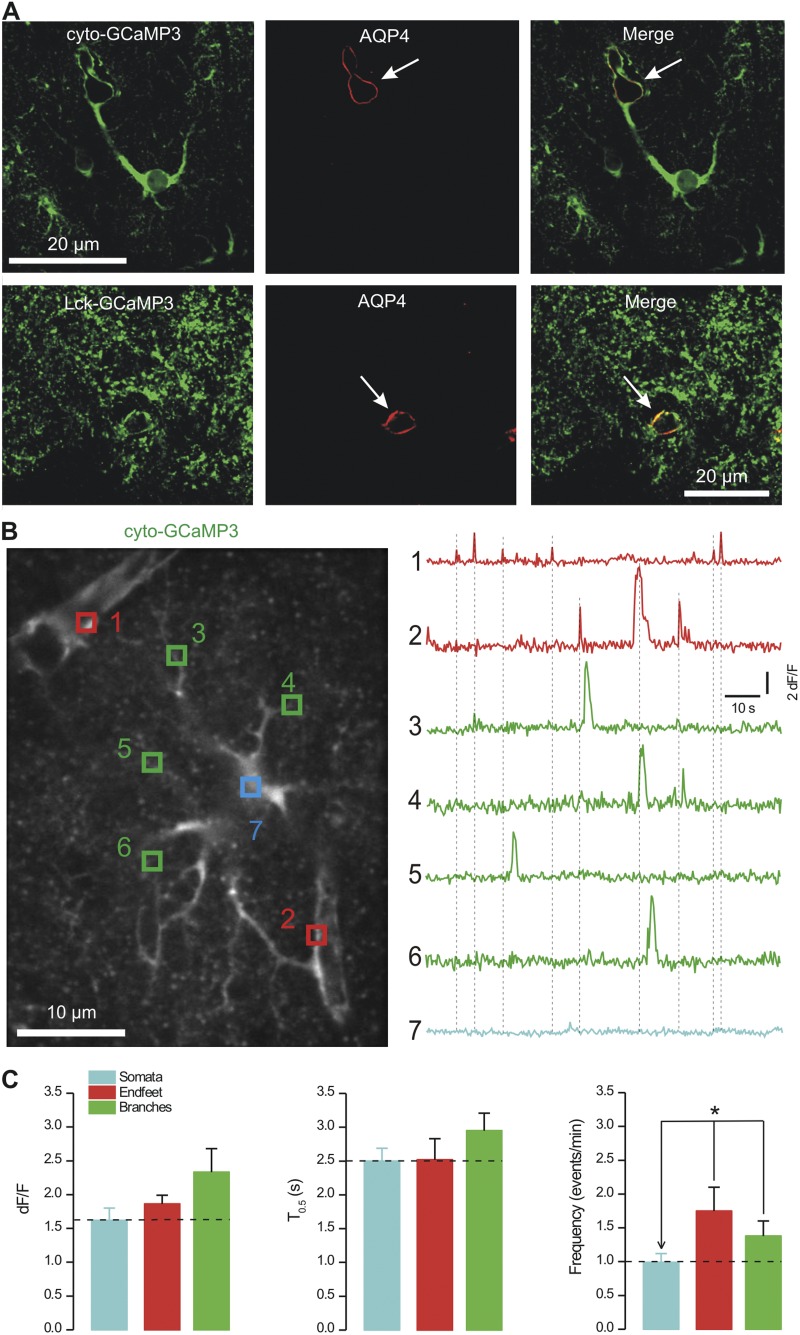
Figure 10.
Cyto-GCaMP3 reveals Ca2+ signals in endfeet. (A) The panels show representative IHC data from optical sections of 3-µm thickness for cyto-GCaMP3 and Lck-GCaMP3 in relation to the endfoot marker AQP4. We found that cyto-GCaMP3 revealed endfeet that enwrapped blood vessels (white arrow), whereas Lck-GCaMP3 revealed smaller fine associations of astrocytes with blood vessels. Note that the staining for Lck-GCaMP3 appears somewhat punctuate in the images that are shown. We attribute this to the fact that these IHC images are from fixed tissue. Also, one must remember that Lck-GCaMP3 is better at labeling the finest processes (in relation to cyto-GCaMP3), which look punctate because they are tiny (see Results). (B) Representative image of an astrocyte expressing cyto-GCaMP3 and with two endfeet onto blood vessels (representative of 12 cells from four mice). The intensities over time of the numbered ROI are shown on the right. Clear endfeet Ca2+ signals, which were independent of those in branches or the soma, were easily observed. (C) Average data for Ca2+ signals measured using cyto-GCaMP3 for somatic, endfoot, and branch regions of astrocytes from the stratum radiatum (n = 12 cells from four mice).

