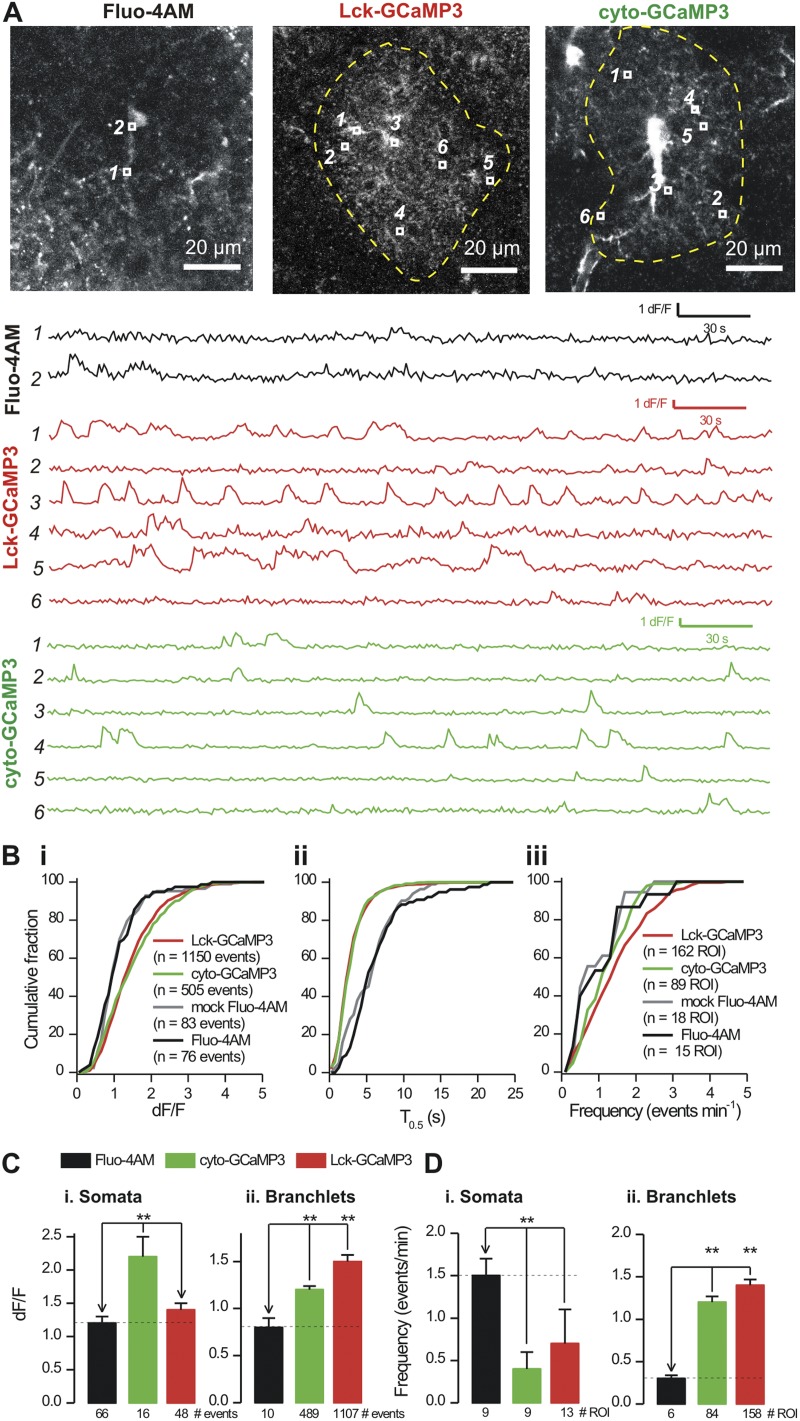
Figure 4.
Ca2+ signals measured with Fluo-4, cyto-GCaMP3, and Lck-GCaMP3. (A) Representative images of an astrocyte loaded with Fluo-4AM and expressing Lck-GCaMP3 and cyto-GCaMP3. ROI are shown in each image, and their intensities are plotted below. (B) Cumulative probability plots for Ca2+ event peak response (i), T0.5 (ii), and frequency (iii) for the indicated experimental groups. The distributions in each experimental condition were different between Lck-GCaMP3 and cyto-GCaMP3 on the one hand, and Fluo-4AM from control and mock (saline-injected) mice on the other (Kolmogorov–Smirnov test). (C and D) Summary graphs for Ca2+ signal properties for astrocyte somata and branchlets under the experimental conditions indicated. Data were gathered from n > 9 for each experimental condition. **, P < 0.01 when compared with an unpaired Student’s t test.

