Figure 4.
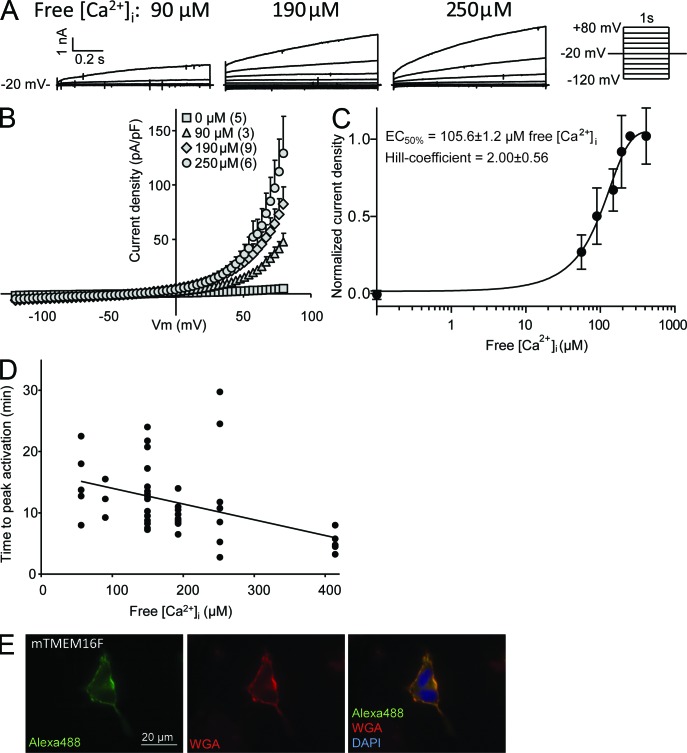
Ca2+ activation kinetics of mTMEM16F. (A) Typical current-voltage relationships of mTMEM16F at max current with 90, 190, or 250 µM free [Ca2+]i. (B) The mean mTMEM16F I-V relation at maximal activation with the indicated free [Ca2+]i, generated from ramp protocol sweeps (from −120 to 80 mV). Data are presented as mean ± SE of three to nine replicates. (C) Hill plot of normalized mTMEM16F ICl,Ca densities at 70 mV. Data are presented as mean ± SE of 3–12 replicates. (D) Ca2+ dependence of mTMEM16F versus time from whole start of whole-cell recording to peak ICa,Cl activation. Linear regression is included to illustrate the decline in the time to peak activation with increasing free [Ca2+]i and is given by f(x) = −0.04x + 14.11. (E) mTMEM16F-GFP expressed in HEK293 cells. Immediately before fixation, the cells were exposed to ionomycin for 20 min in a solution containing 500 µM free Ca2+. The images were taken using an epifluorescence microscope. mTMEM16F-GFP was visualized with anti-GFP and Alexa Fluor 488, whereas the plasma membrane was stained using rhodamine-conjugated WGA. The nucleus was stained with DAPI.

