Fig 4.
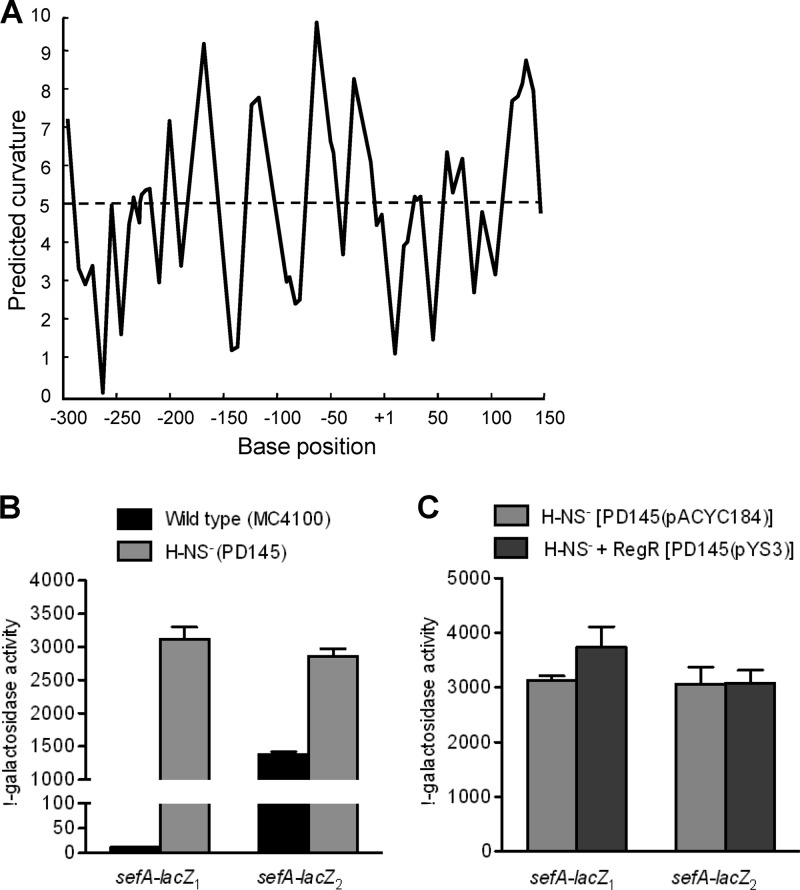
Analysis of H-NS-mediated repression of the sefA promoter. (A) In silico analysis of intrinsic curvature of the sefA regulatory region, using the bend.it program (http://hydra.icgeb.trieste.it/dna/index.php). The regions with >5 degrees per helical turn of DNA (dashed line) represent curved sequences. The base position is relative to the transcriptional start site of sefA. (B) Effects of H-NS on the expression of sefA. E. coli strains MC4100 (H-NS+) and PD145 (H-NS−) which contained either sefA-lacZ1 (−309 to +155) or sefA-lacZ2 (−51 to +155) were assayed for β-galactosidase activity. (C) Effects of RegR on the expression of sefA in the H-NS− background. E. coli strains PD145(pACYC184) (RegR−) and PD145(pYS3) (RegR+) which contained either sefA-lacZ1 (−309 to +155) or sefA-lacZ2 (−51 to +155) were assayed for β-galactosidase activity. The β-galactosidase activities (Miller units) shown are the means (± standard deviations [SD]) of results from three independent experiments.

