Fig 1.

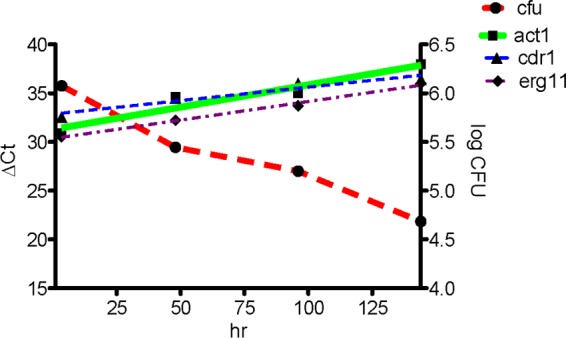
Comparison of spleen CFU and ΔCT values of ACT1, CDR1, and ERG11 in the same spleen following the intravenous injection of 107 CFU of strain 84 into C57BL/6J mice. Each time point shows the average from three mice.

Comparison of spleen CFU and ΔCT values of ACT1, CDR1, and ERG11 in the same spleen following the intravenous injection of 107 CFU of strain 84 into C57BL/6J mice. Each time point shows the average from three mice.