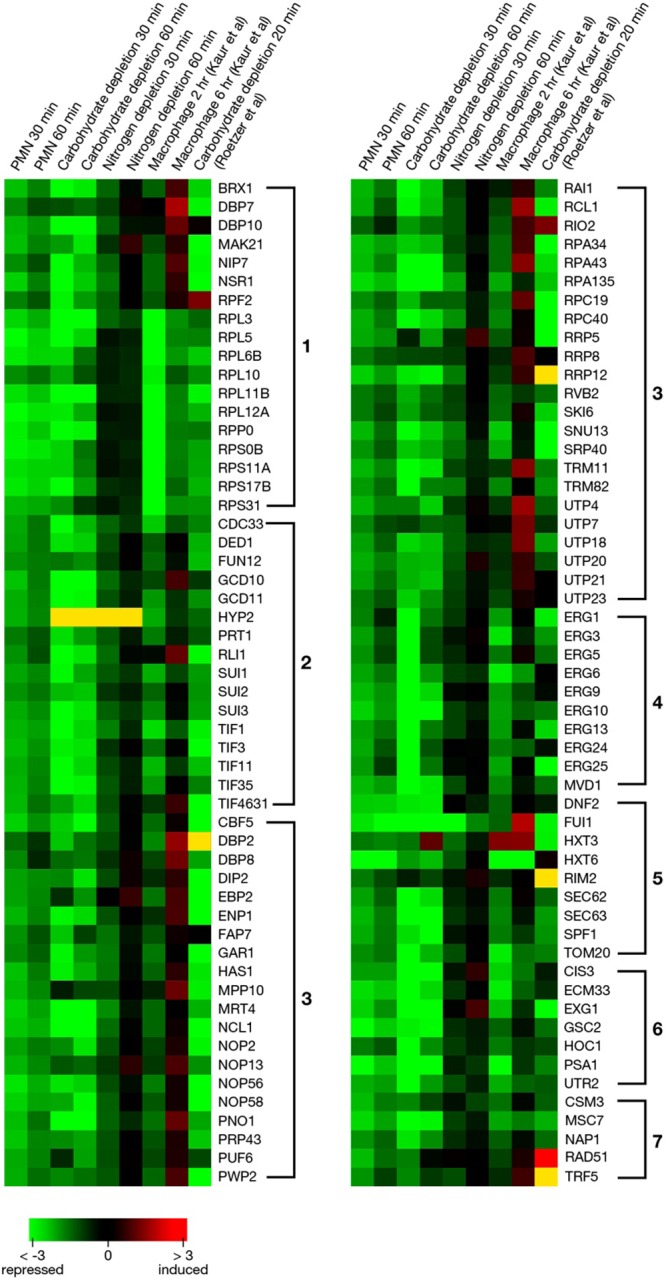
Fig 6.

Heat map to compare expressions of significantly downregulated genes in neutrophils and under carbohydrate and nitrogen deprivation. Expression data of C. glabrata exposed to a murine macrophage-like cell line for 2 or 6 h (7) or to carbohydrate depletion for 20 min (22) were extracted from published data to compare with our results. The indicated color scale is based on log2 changes. Yellow indicates that a signal was not detected.
